Blog
Welcome to the Time Price Analysis Blog. Here you will find articles and analysis from our experts on some of the trends we are following and the market movements we expect to unfold. If you would like to receive updates when we post new articles then but if you would like to see the data behind our articles then

Slow down in housing market: Can it predict the end of the next U.S. recession?

Mike Richards on 27/09/2022 570 days ago

Composite Cycles Model on New Home Sales indicates possible end for U.S. recession as early as summer 2024


New Home Sales - also known as "New Residental Sales" - is an economic indicator that measures sales of newly built homes. New home sales data is one of the best leading indicators of the housing market. When new home sales data shows a significant decline, telling us not only that new homes being built are not selling, but also that people who started building a home are no longer buying the completed homes, it is a clear indication of a slowdown in the housing market and a possible recession.

That is the usual reading of this data set. However, cycle analysis allows us to delve deeper on this data set. Since the selling and buying of houses is also a kind of sentiment measurement of market participants, it is a good candidate for cyclical movements.


Write comment Views: 2896 Comments: 0

Can We Use Net Liquidity to Predict The Market?

Mike Richards on 13/08/2022 615 days ago

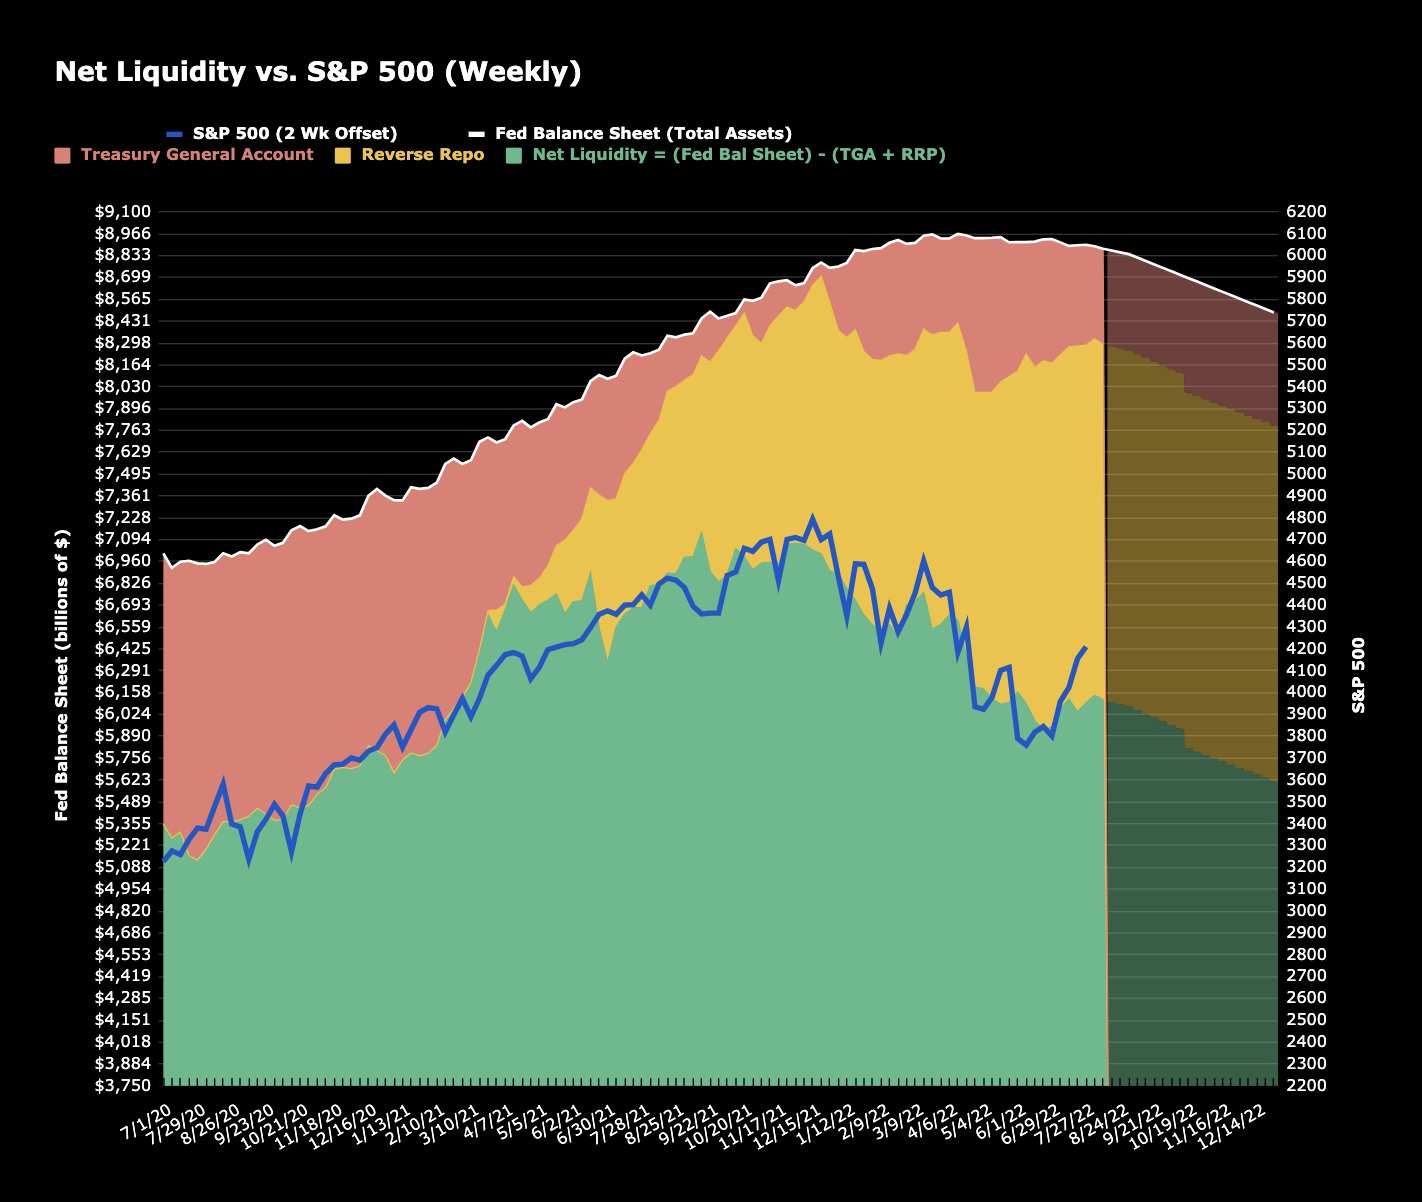
A a metric based on a calculation of Net Liquidity suggests that the  SPX is now over 300 Points "Over Valued" which represents the largest deviation seen at any time over the last two years. So, how to we come to this assessment and how useful has this been in recent times? FED followers have traditionally tracked the Feds balance sheet and the Fed Fund Rate, the theory being that these are the central driving forces behind the markets. These matrices have certainly been of relevance especially since the advent of QE going back to 2009. Since 2020 the system has changed. The Fed went into overdrive and printed a whopping 4.5 Trillion Dollars. This was an un precedented avalanche of money which had the effect of roughly doubling the size their balance sheet. This was widely broadcast and known but what was less obvious was the Treasury deciding to provision itself with a whopping 1.8 Trillion Dollars in Reserves, 4.5 times the previous largest amount ever held at the Treasury General Account (TGA). Over the course of 2020 & 2021 the liquidity flows from the FED and Treasury combined fuelled a stupendous market rally. This came to an abrupt halt as we entered 2022. The Treasury curtailed its flow of shorter dated paper that typically facilities the Primary Dealers proving liquidity to both the Stock & Bond Markets while the FED simultaneously raised the award rate on the Reverse Repo Deposits thus resulting in over 2 Trillion of liquidity getting sucked into Reverse repo Accounts. This was six times more than we have ever seen in the past. 

In the past we have been able to simply use the size of the FEDs balance sheet as a rough but usable metric for Net Liquidity. Now, we need to consider the Reverse Repro Account combined with the Treasury General Account as part of the equation, thus:


Net Liquidity = Fed Balance Sheet -(TGA + RR). 


The chart above shows the calculated Net Liquidity VS The S&P 500 offset backwards by two weeks over the last two years. The correlation is 95%. This demonstrates that a change in Net Liquidity correlates to a range in asset prices two weeks forward with a historical accuracy of 95% based on the current regime. 

Write comment Views: 4069 Comments: 0

Treasury yield curve inversion and cycle model signal trouble for stock markets

Mike Richards on 11/08/2022 618 days ago

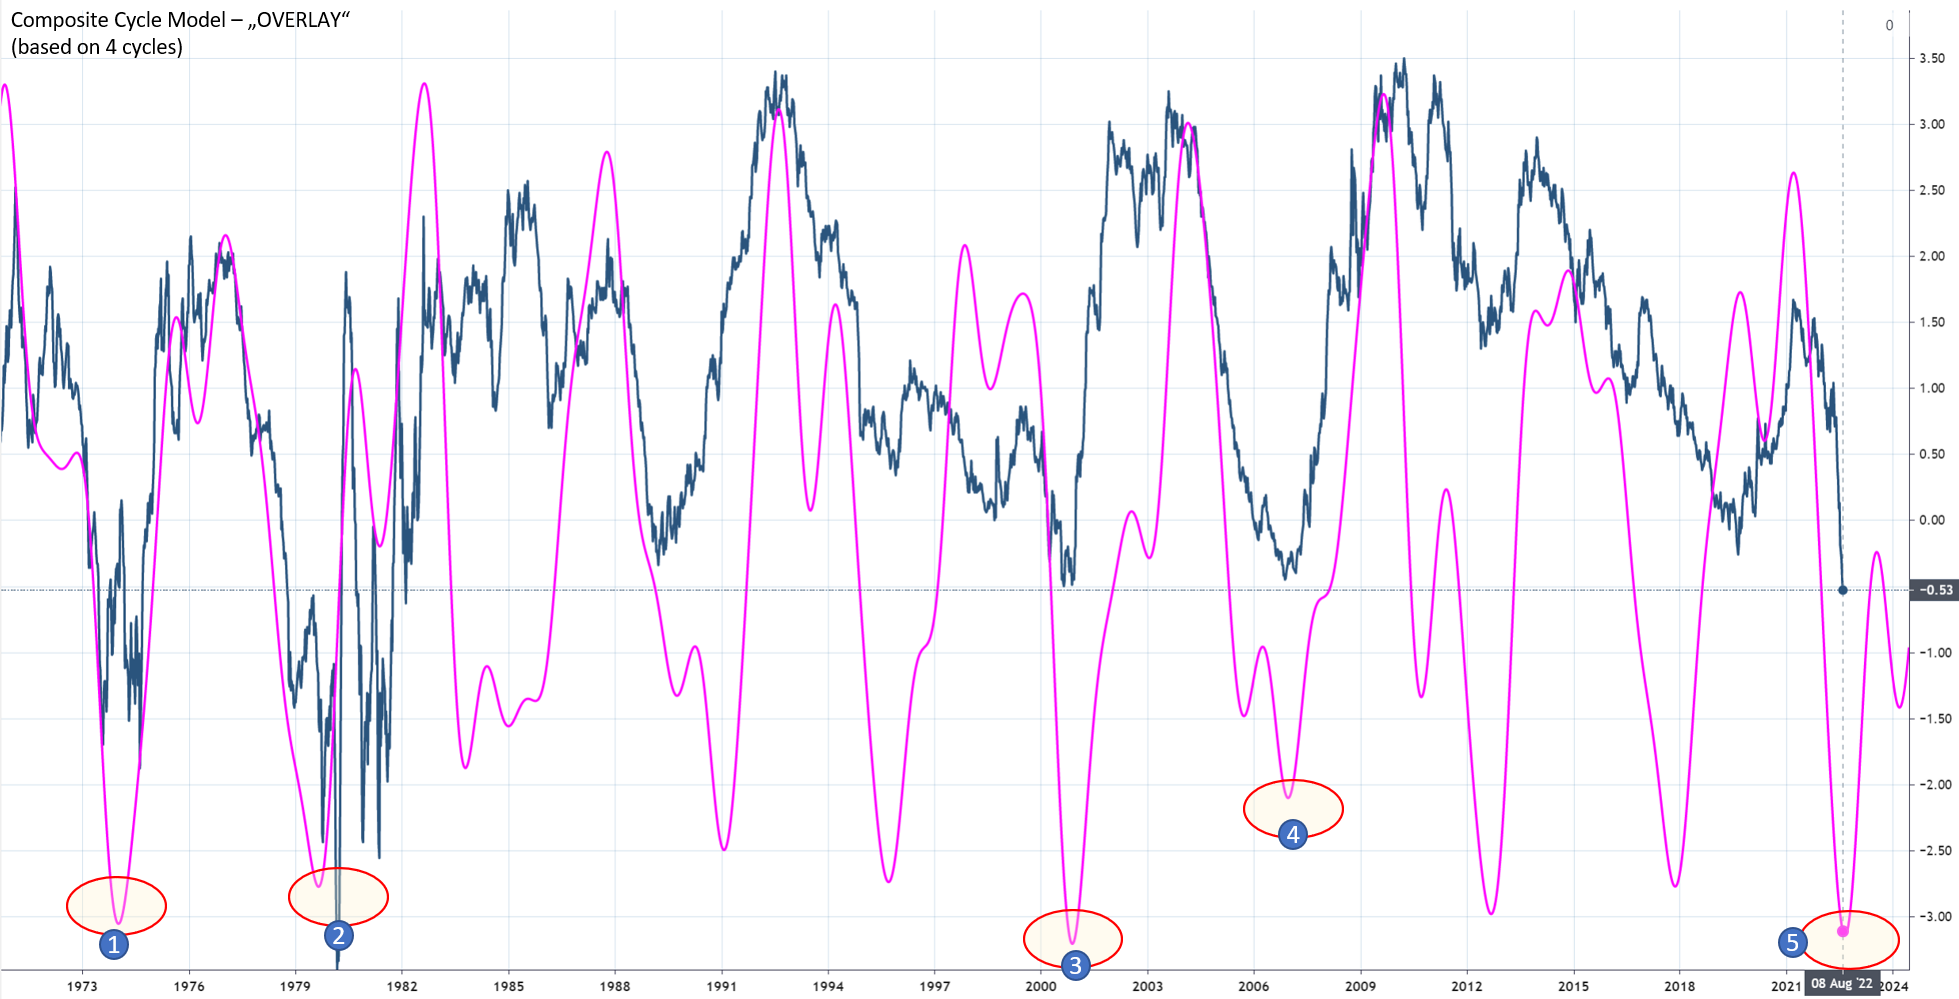
The following chart shows the 10 year US treasury minus the 1 year treasury spread curve in blue. The current yield curve is negative which results in an inverted yield curve. Attention is keenly focused on the yield curve slope as sustained inversions in past decades have been followed by economic downturns over the ensuing 12 to 18 months.

We have applied the cyclic model and have gathered 5 dominant cycles in the treasury spread. The detected five cycles form a composite model and are overlayed in fuchasia in the chart below. The cyclic model is able to predict major turns in the yield curve. Proposing a cyclic turn might be around the corner. As indicated at point #5 on the chart.

Write comment Views: 2484 Comments: 0

Have Stocks & Bond Markets Seen The Lows for This Year?

Mike Richards on 03/08/2022 625 days ago

In short, NO!

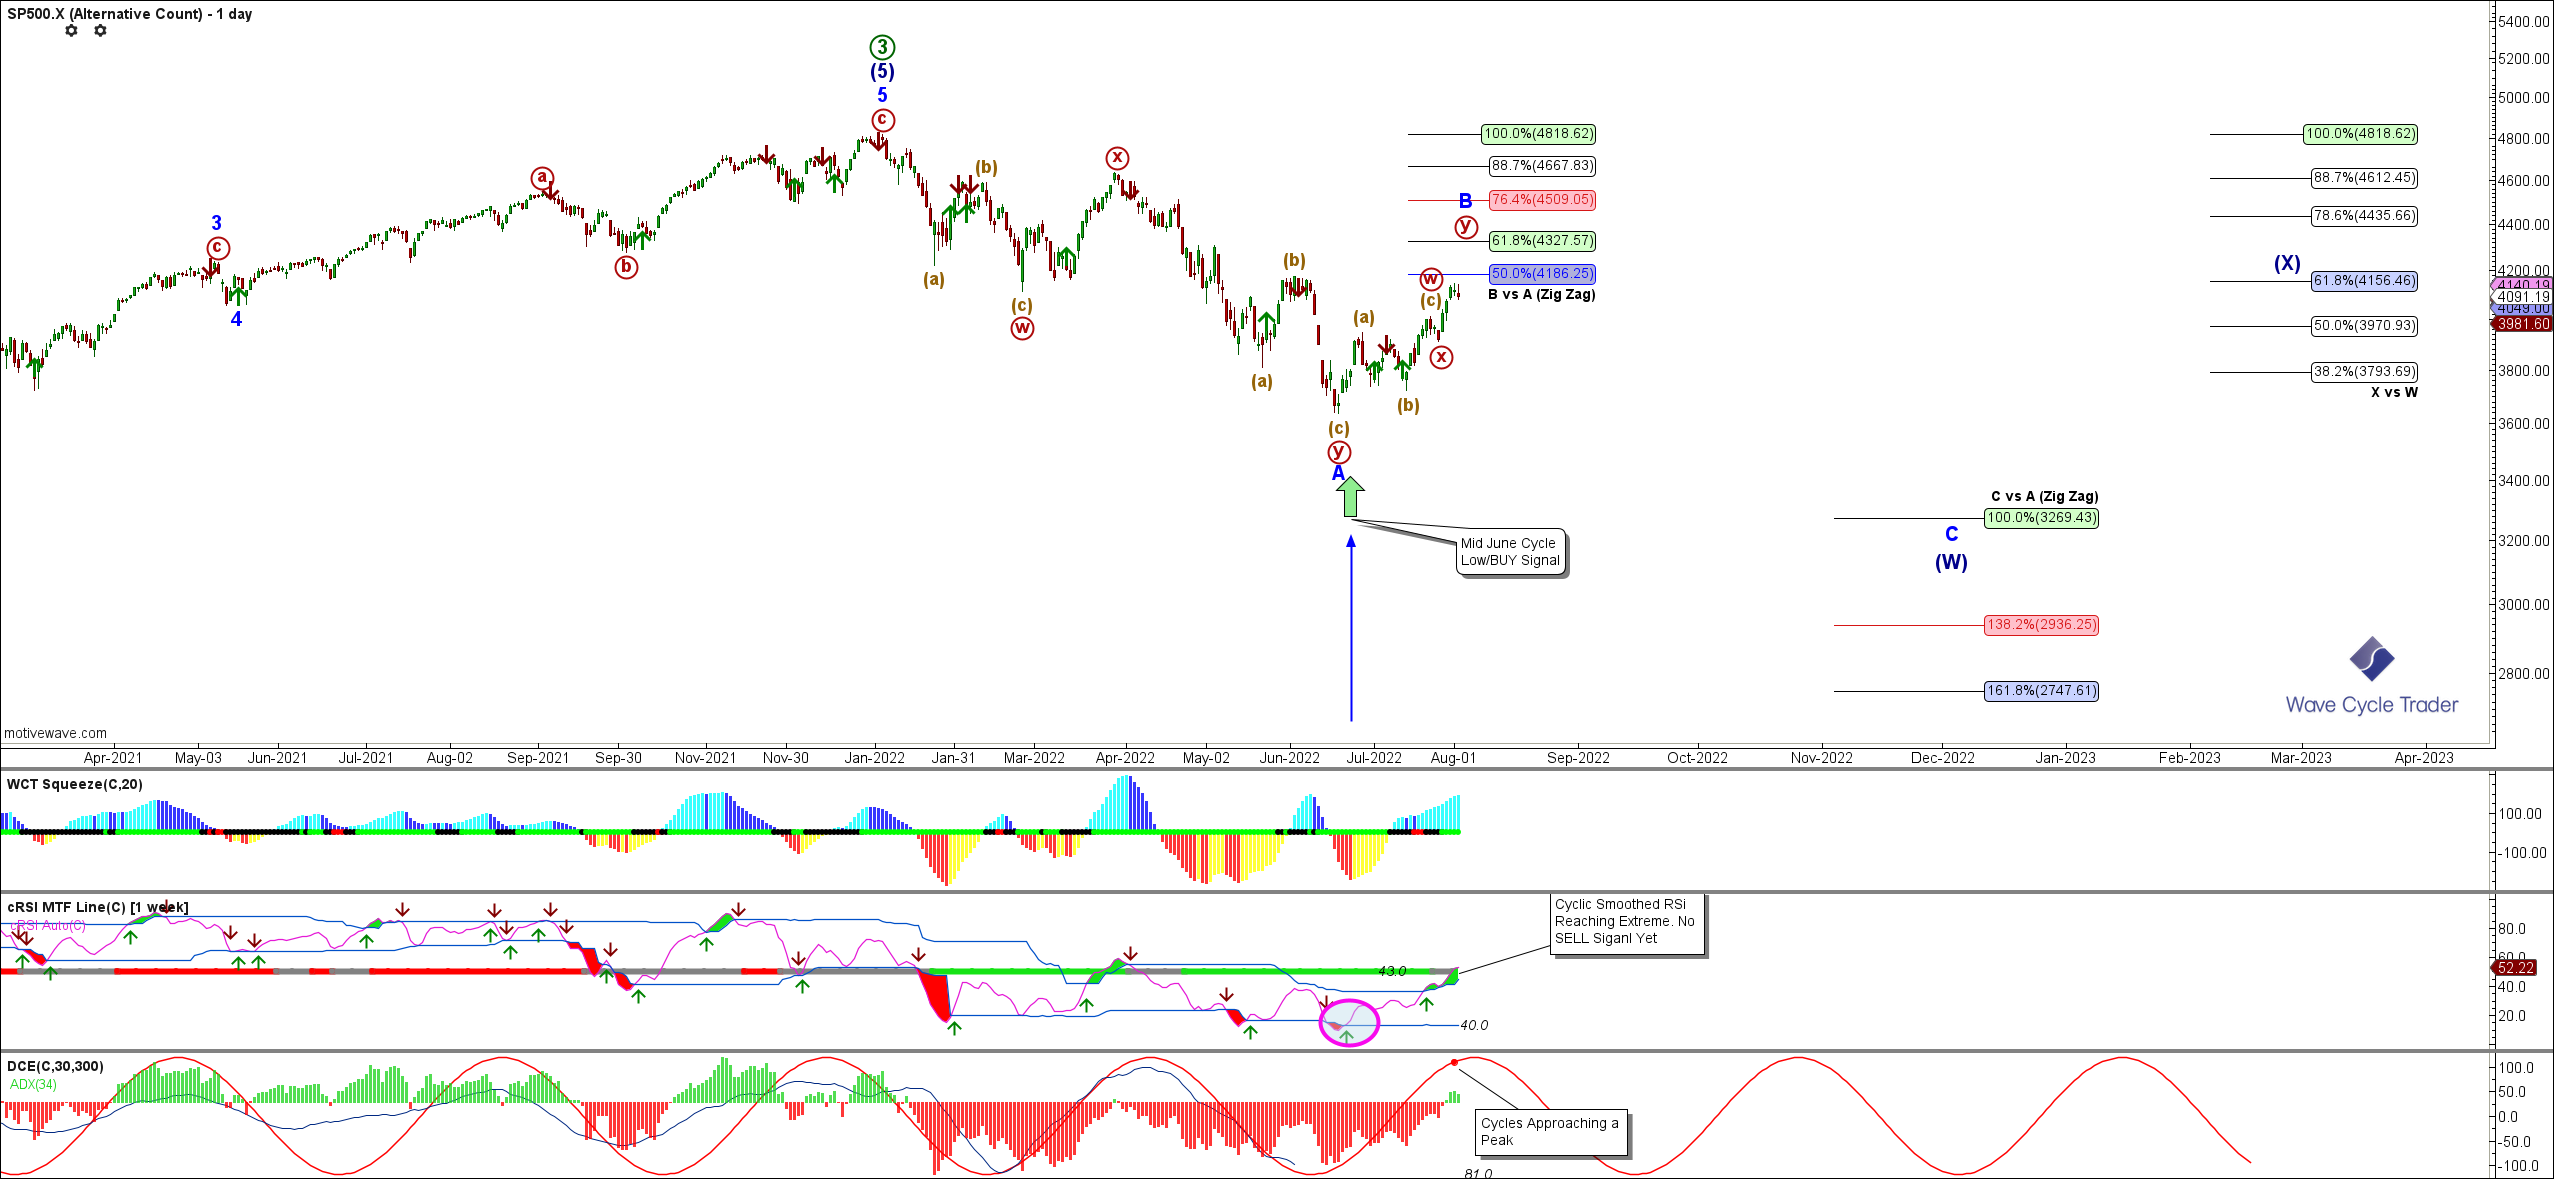
We’ve seen US Stock Indices rally strongly higher off the Mid June 2022 lows in tandem with US Bonds. The conditions were right for this rally, with liquidity being supportive along with the shorter time frame cycles projections we have been posting in the TPA Service suggesting a move up into early to mid August. The Markets did their job of squeezing the shorts and creating a false narrative about pending recession and the end of Fed tightening to drive the rally. It has all been the usual, predicable BS, but it has worked.

Write comment Views: 2539 Comments: 0

Crypto Currencies Ripping Higher - Who Knew?

Mike Richards on 05/05/2021 1080 days ago

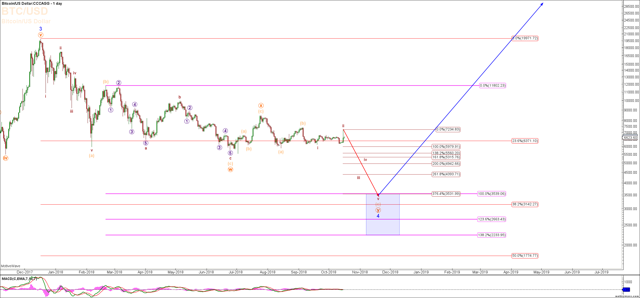
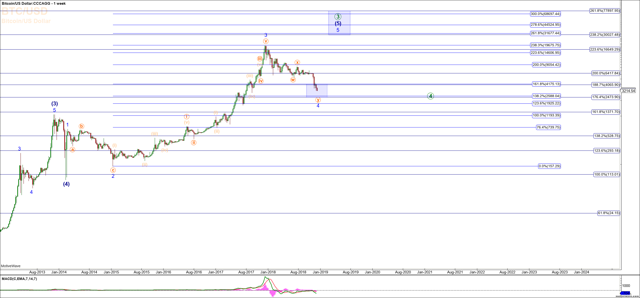
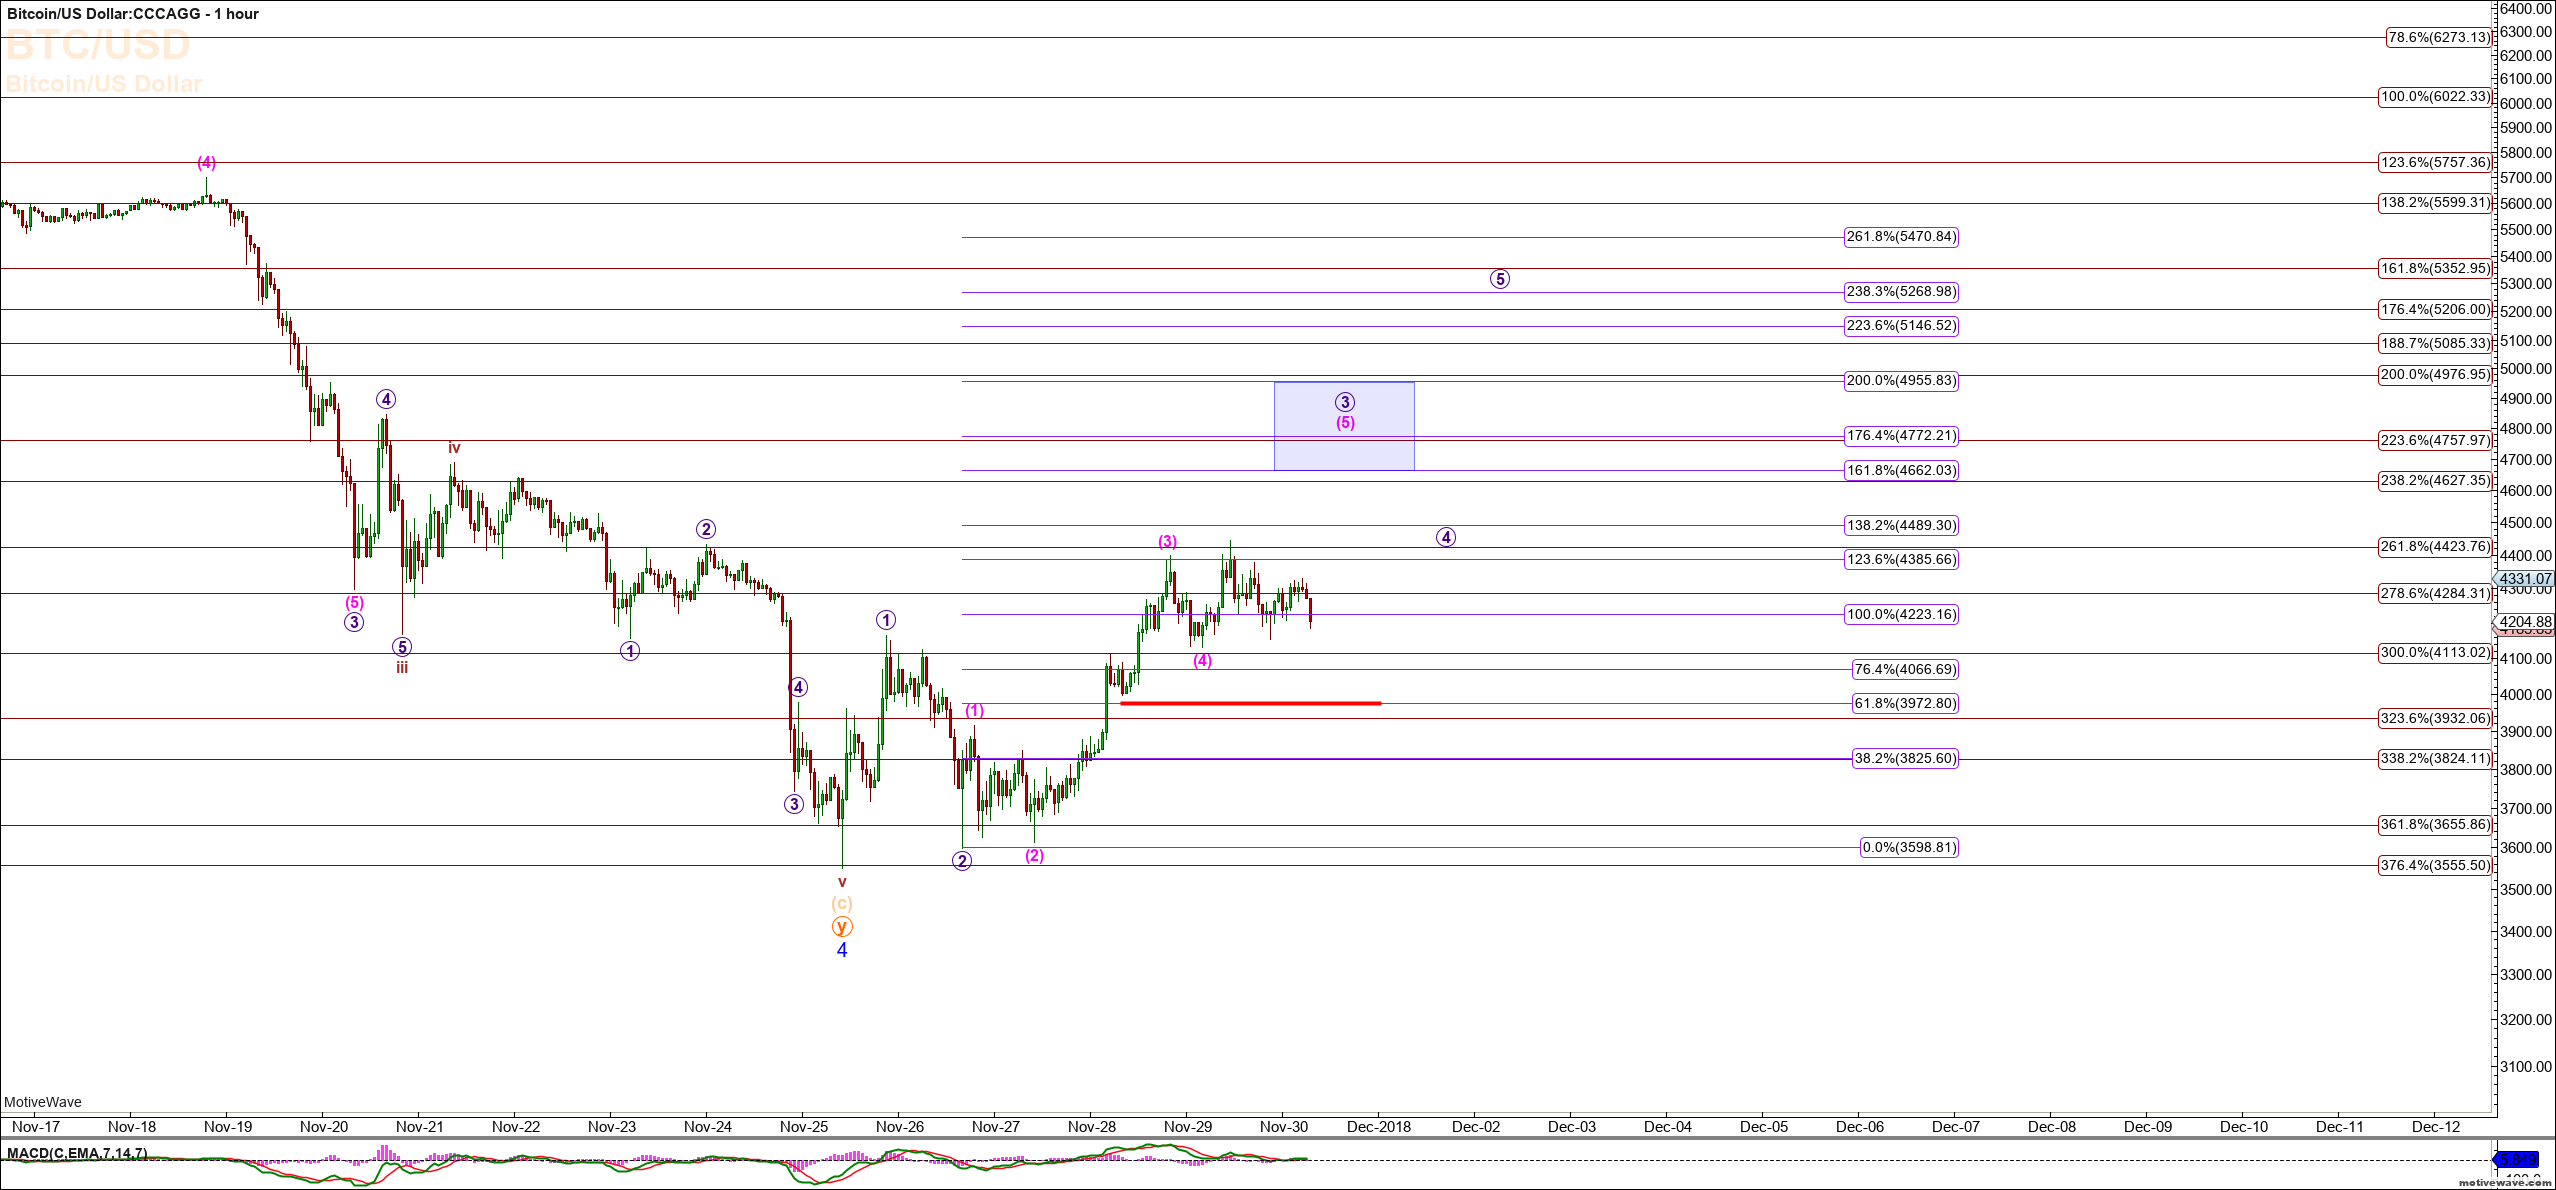
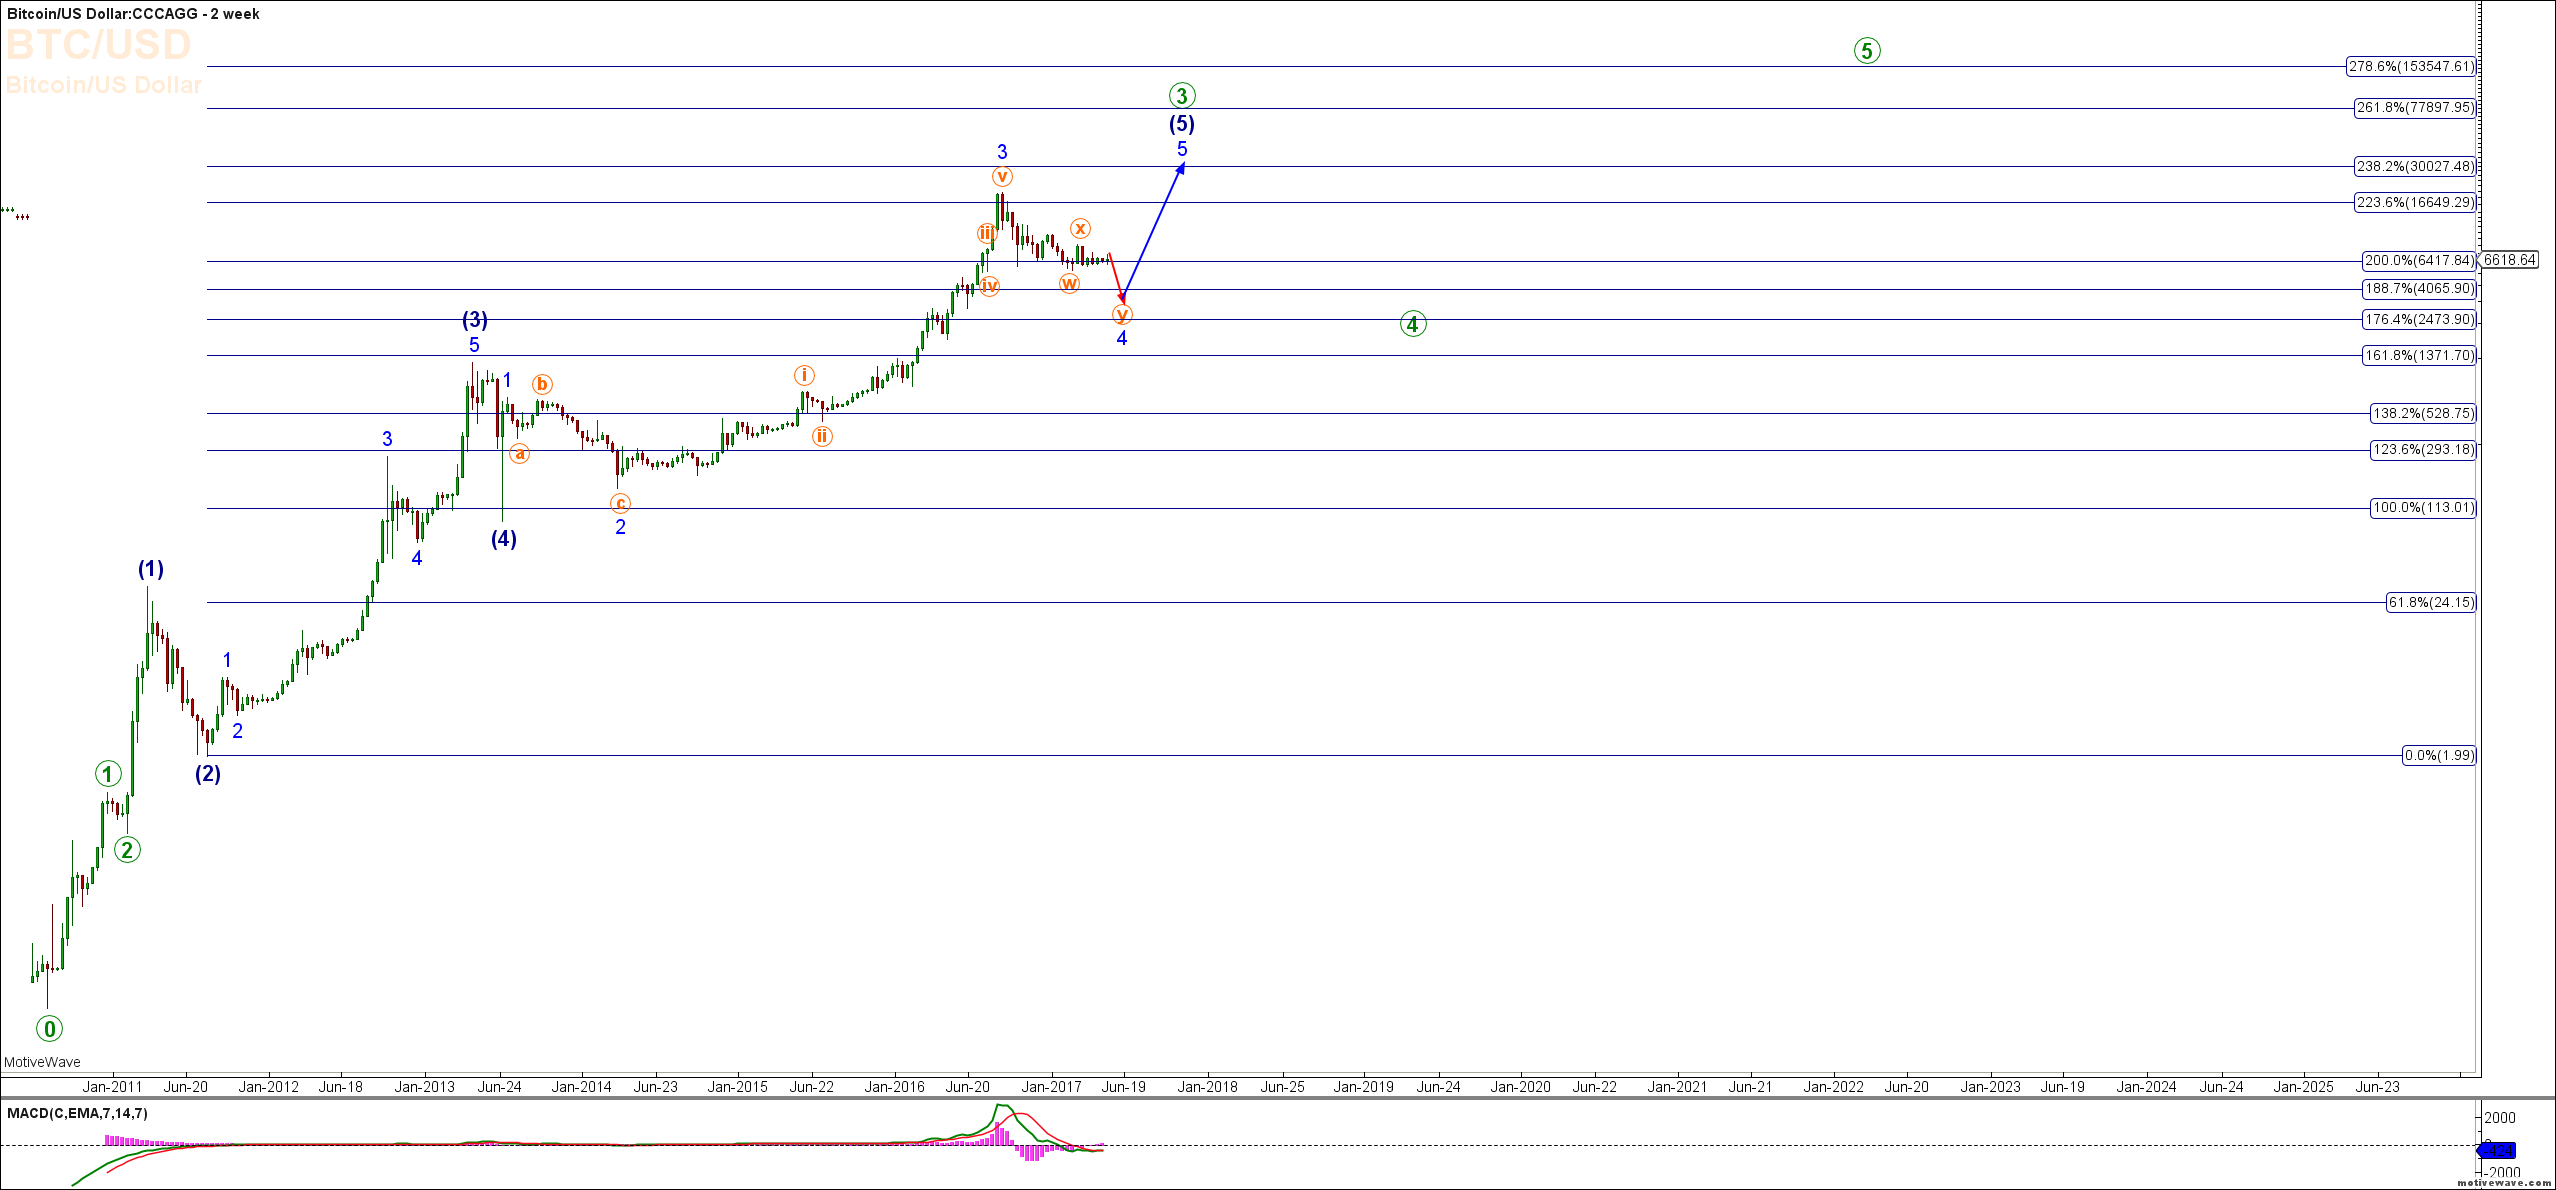
Millennial, Lamborghini Driving Bit Coin Millionaires, Social Media Twitter Heads, Even the Multi Billionaire Mr Musk are all on board the Crypto Currency wave of Euphoria. Back in late 2018 into early early 2019 with Bitcoin dropping from its then all time highs into the low 3000’s did anyone know that it was the time to be getting on board this seemingly unstoppable rocket? If they did, then had they any idea at that time of knowing just what dizzy heights these “alternative” currencies might go? 
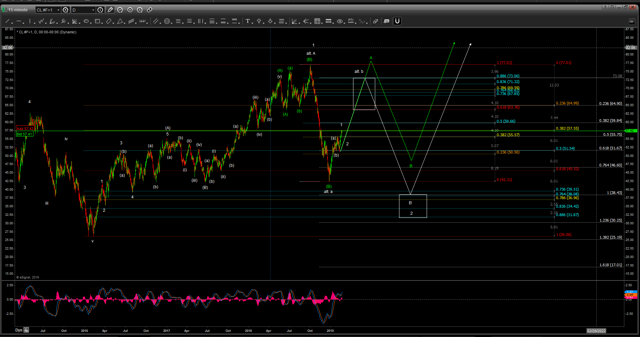


We published a series of articles at that time in which we suggested that indeed it was an opportune moment to consider getting involved and we also provided ideas on what levels we expected to see over the coming months and years. 


This is what we had to say back in October of 2018. 


Write comment Views: 4583 Comments: 0

Can US Stock Indices Still Go Higher?

Mike Richards on 18/04/2021 1098 days ago

US Stock Indices have seen unprecedented gains since the lows back in March 2020. The moves down into those lows from the highs barely one month earlier in February 2020 were the fastest on record yet just over one year later and against a back drop of a global pandemic the US Markets are seeing consistently higher then higher new all time highs. Put Call Ratio’s, Price Earnings Ratios and a host of other metrics are regularly touted across social media platforms as being at or beyond levels where we “should” see markets reverse yet prices stubbornly refuse to “do the obvious” by moving lower and appear immune to the fears and trepidations of the wounded and howling Bears while the Bulls point to the improving unemployment numbers, retail sales figures and economies re opening coupled with the extraordinary actions of the Federal Reserve.

Write comment Views: 1760 Comments: 0

ZOOM (ZM) Trade Follow Up

Mike Richards on 01/09/2020 1326 days ago

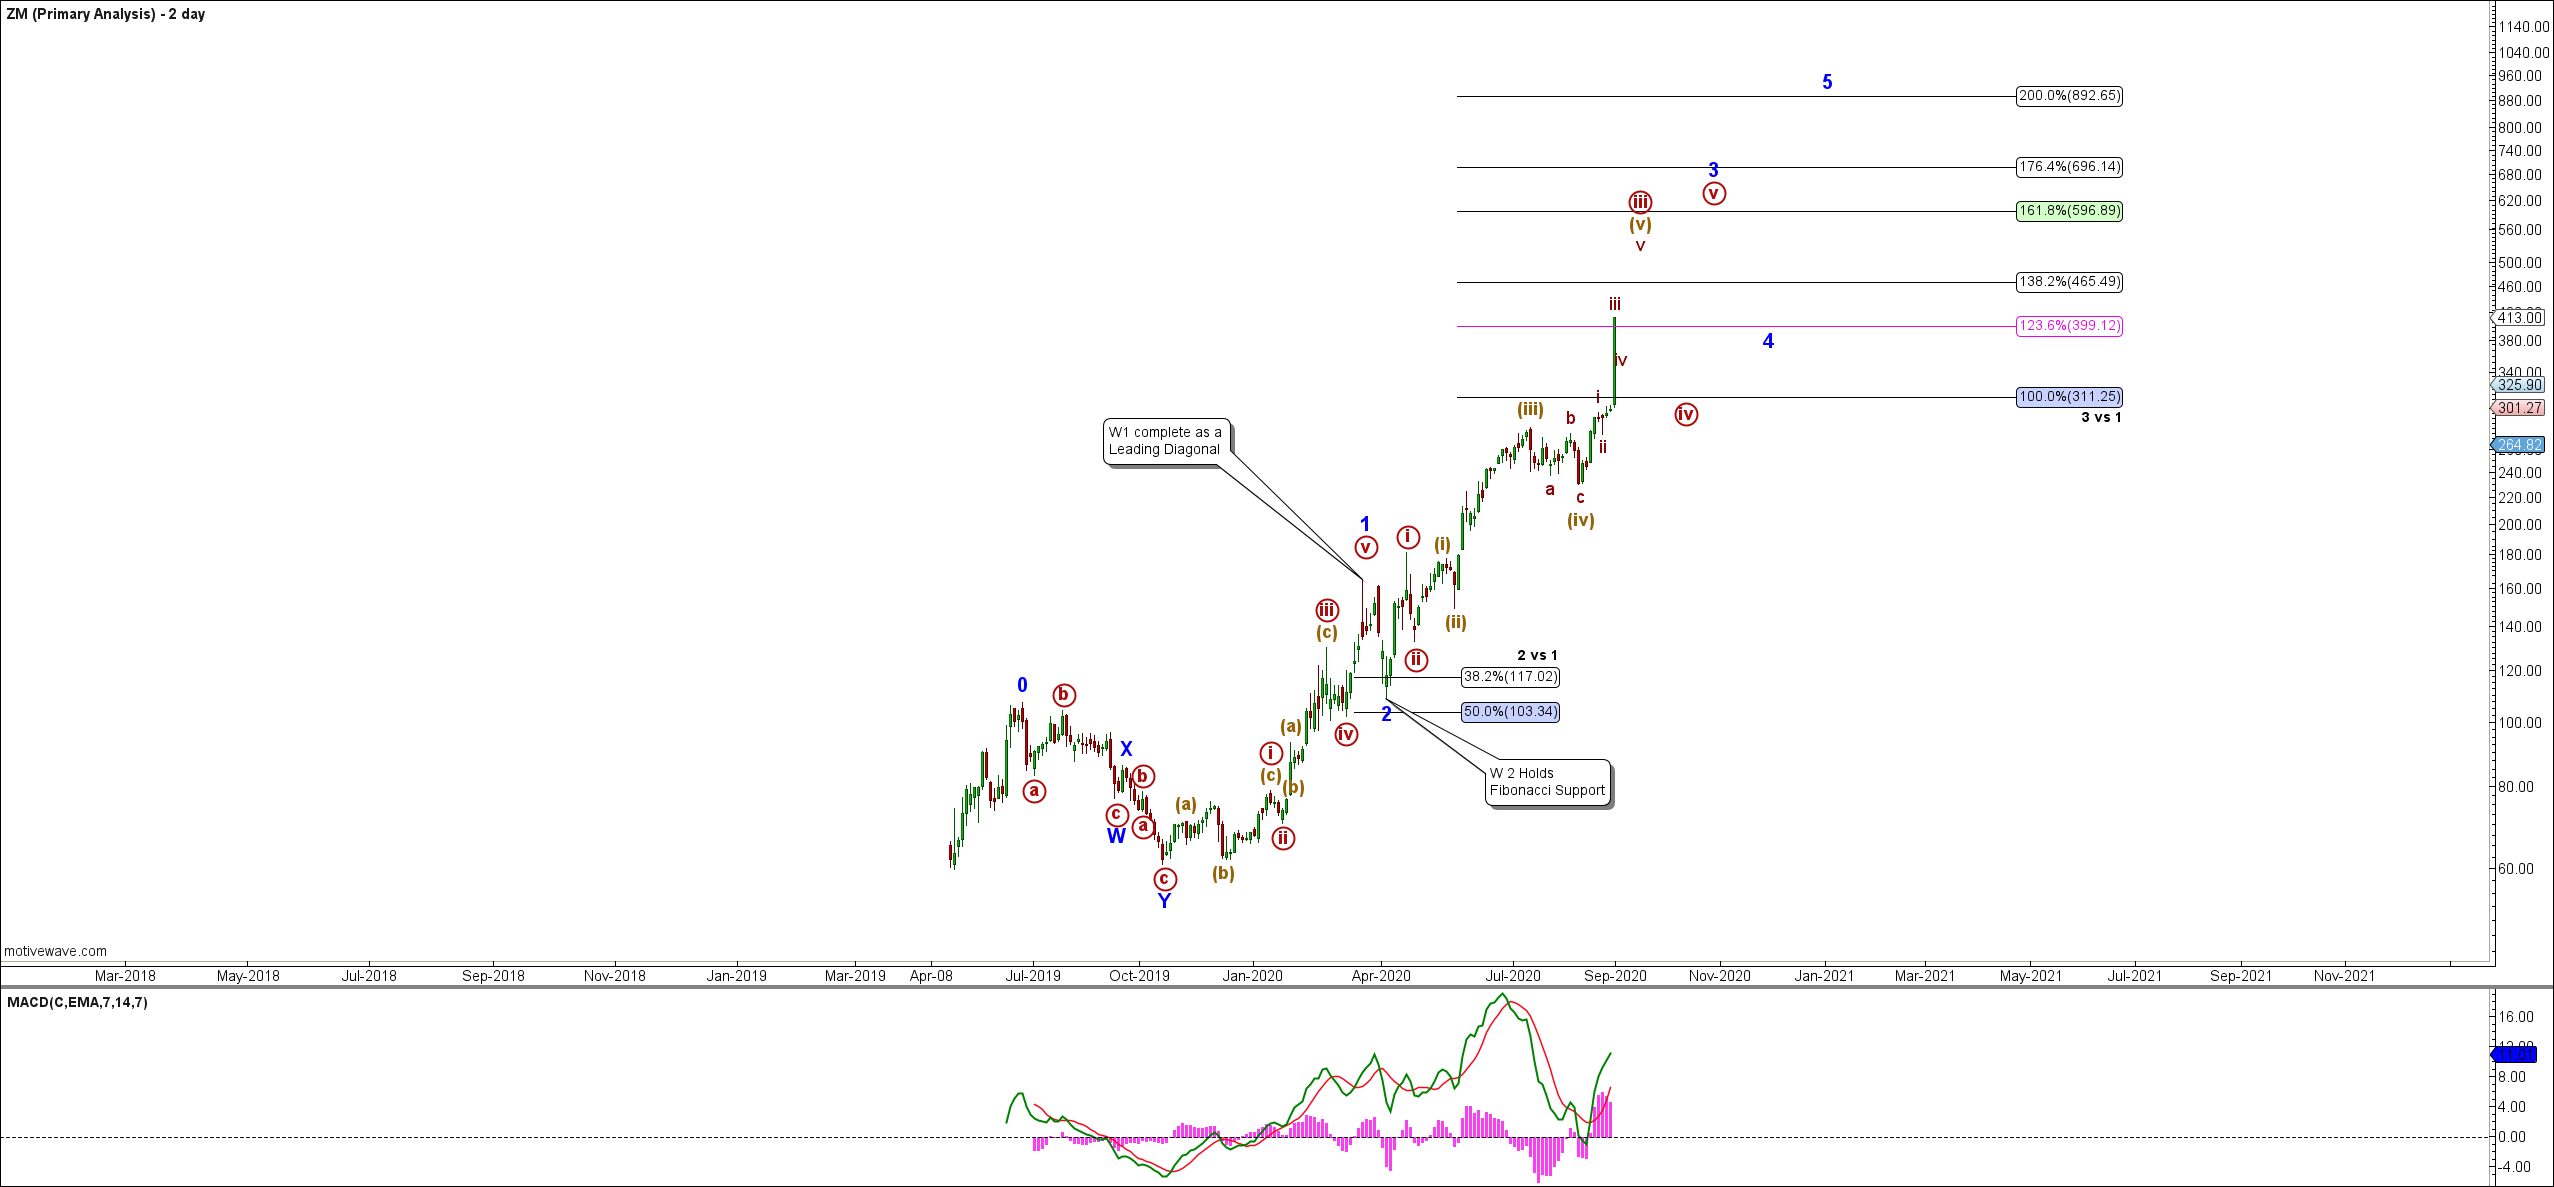
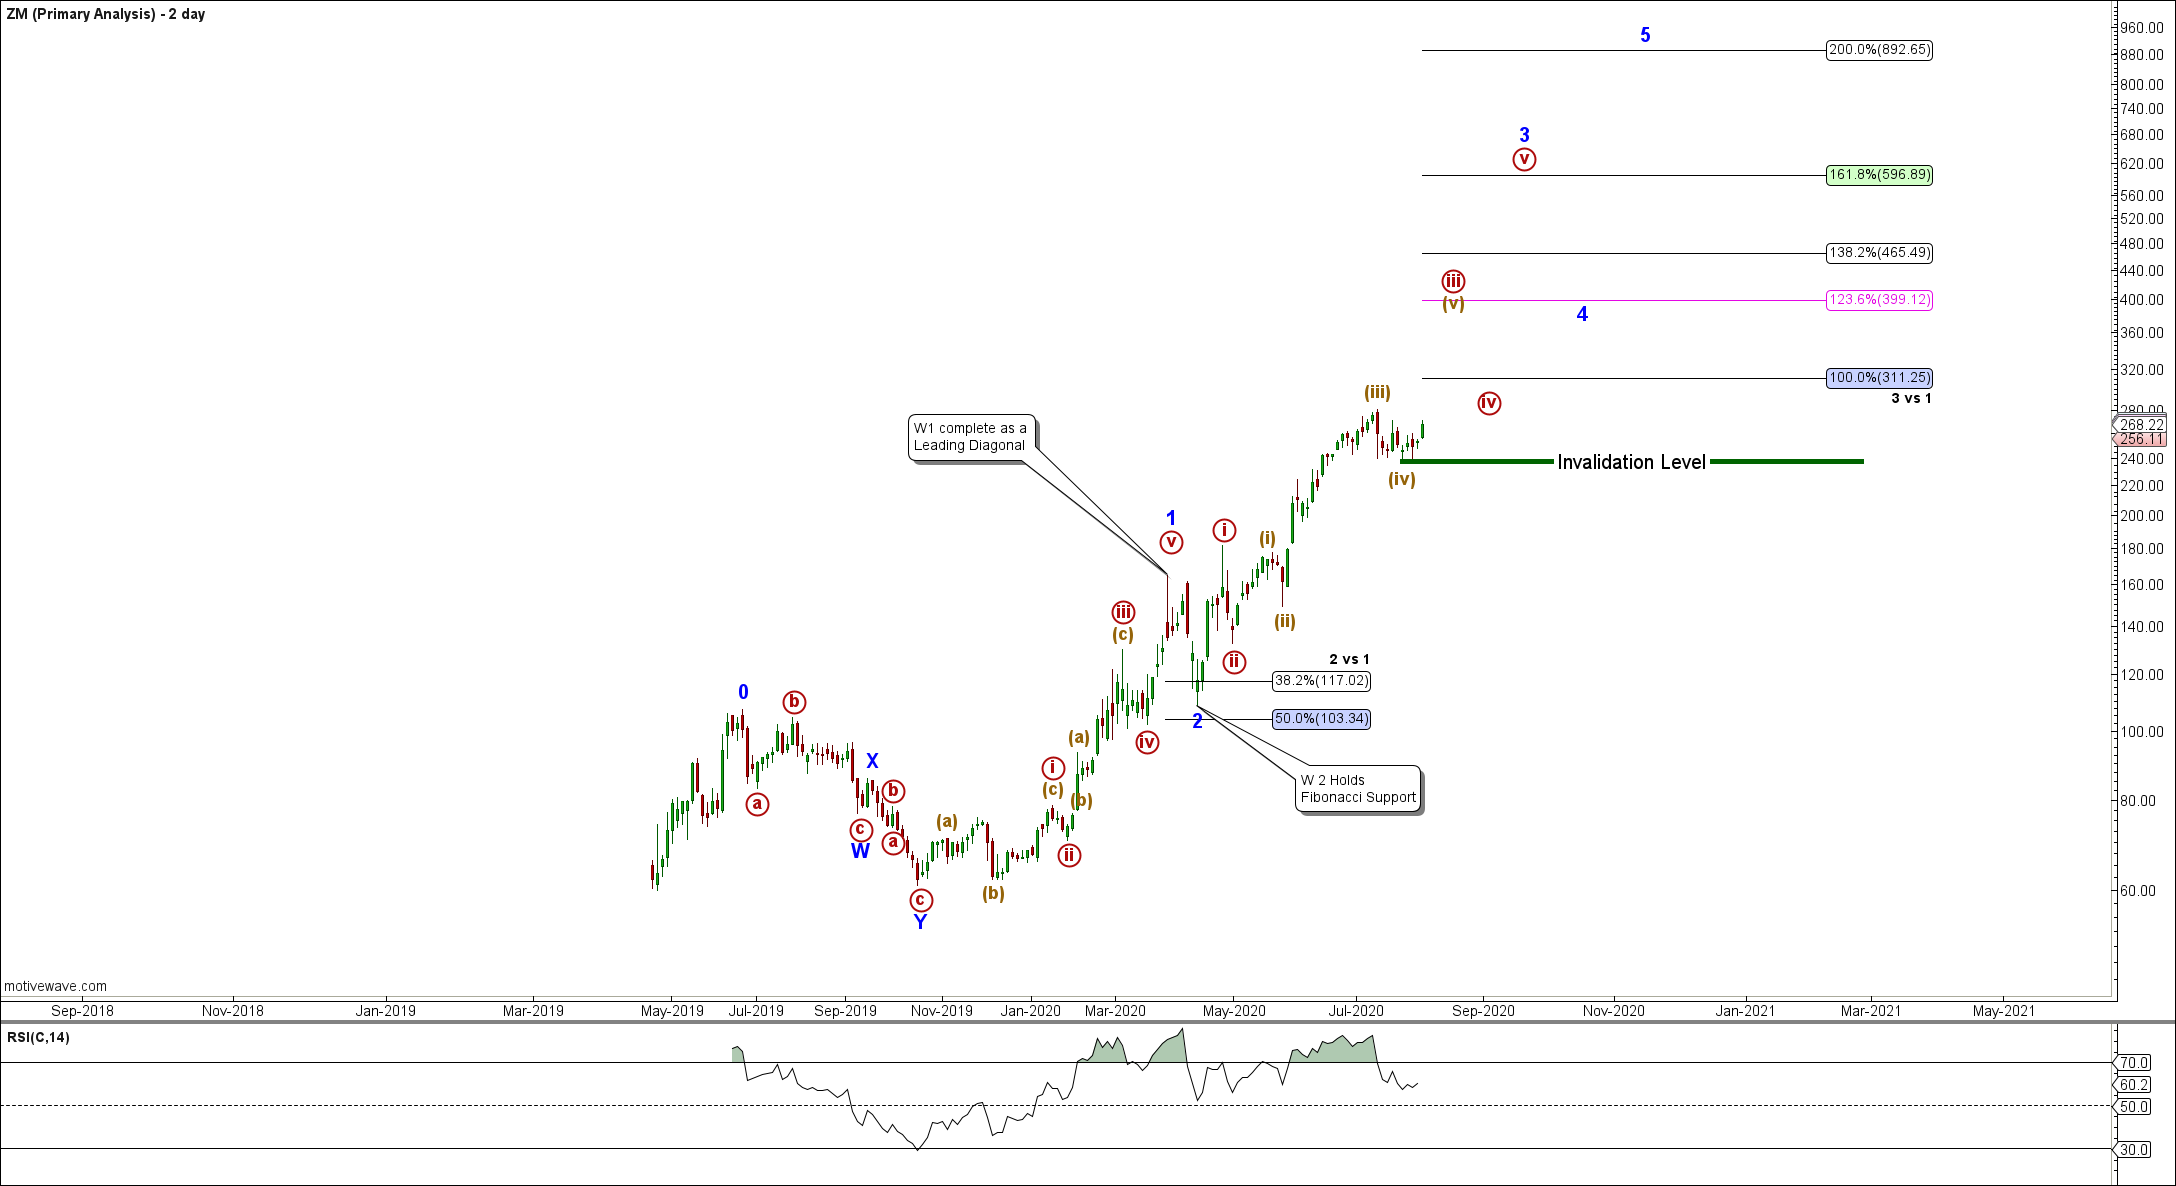
Following up on the article posted back on 4th August (Everyone's Zooming These Days) I flagged Zoom as a potential buy at $268 with an initial target of $399 we have now seen this stock progress to the upside and slightly exceed that initial target. At the time we were looking for a bullish momentum run into the quarterly earnings announcement which was expected to be positive. Zoom reported earnings after the closing bell yesterday (Monday 31st August 2020). The company reported second quarter income of $185.7 million, 63 cents per share on sales of $663.5 million. This is against analysts expectations of 45 cents per share and sales of $500.3 million. Forward guidance was also positive all of which saw the shares extend recent gains after hours and the stock is now trading at $412.25 pre market. 


Write comment Views: 2319 Comments: 31

The Eye Of the Storm Change Can Be Painful

Mike Richards on 18/08/2020 1340 days ago

This article is taking a ‘Bigger Picture” perspective on where we all stand and the direction in which we are heading.  The decade of the 2020’s is one where the institutional and social cycles converge, ending in the same 10 year period. It is the period of the “Storm Before The Calm” , a period of transition from one social economic cycle to the next, a period of change. This of course has a direct correlation on the emotional cycles that are also being seen.


Write comment Views: 4584 Comments: 0

Mind The (Liquidity) GAP

Mike Richards on 10/08/2020 1348 days ago

Since early July we have seen every pullback in the US Markets hold above support and then push higher resulting in the upward chop to new highs week after week. The liquidity landscape has been hugely supportive during this period leaving Primary Dealers flush and markets buoyed. 


Taking stock and looking forward over the coming weeks and months things may not be so straight forward (or “upward”) from here. 

Write comment Views: 2011 Comments: 0

Are US Markets About to Pullback?

Mike Richards on 06/08/2020 1352 days ago

US Markets have been on a tear to the upside since the dramatic drop into the lows seen earlier this year. The technology heavy Nasdaq has exceeded its all time high from February 2020, The S&P 500 is now approaching that same high while the Dow Jones Industrial Average & Russell 2000 Small Cap Index are lagging slightly behind. With the world seemingly in turmoil & in the grip of the Covid 19 Pandemic, Central Bankers printing money and throwing it around like confetti, unemployment rising and the leaders of Nations providing little more than a tragic puppet show this all seems counter intuitive. 


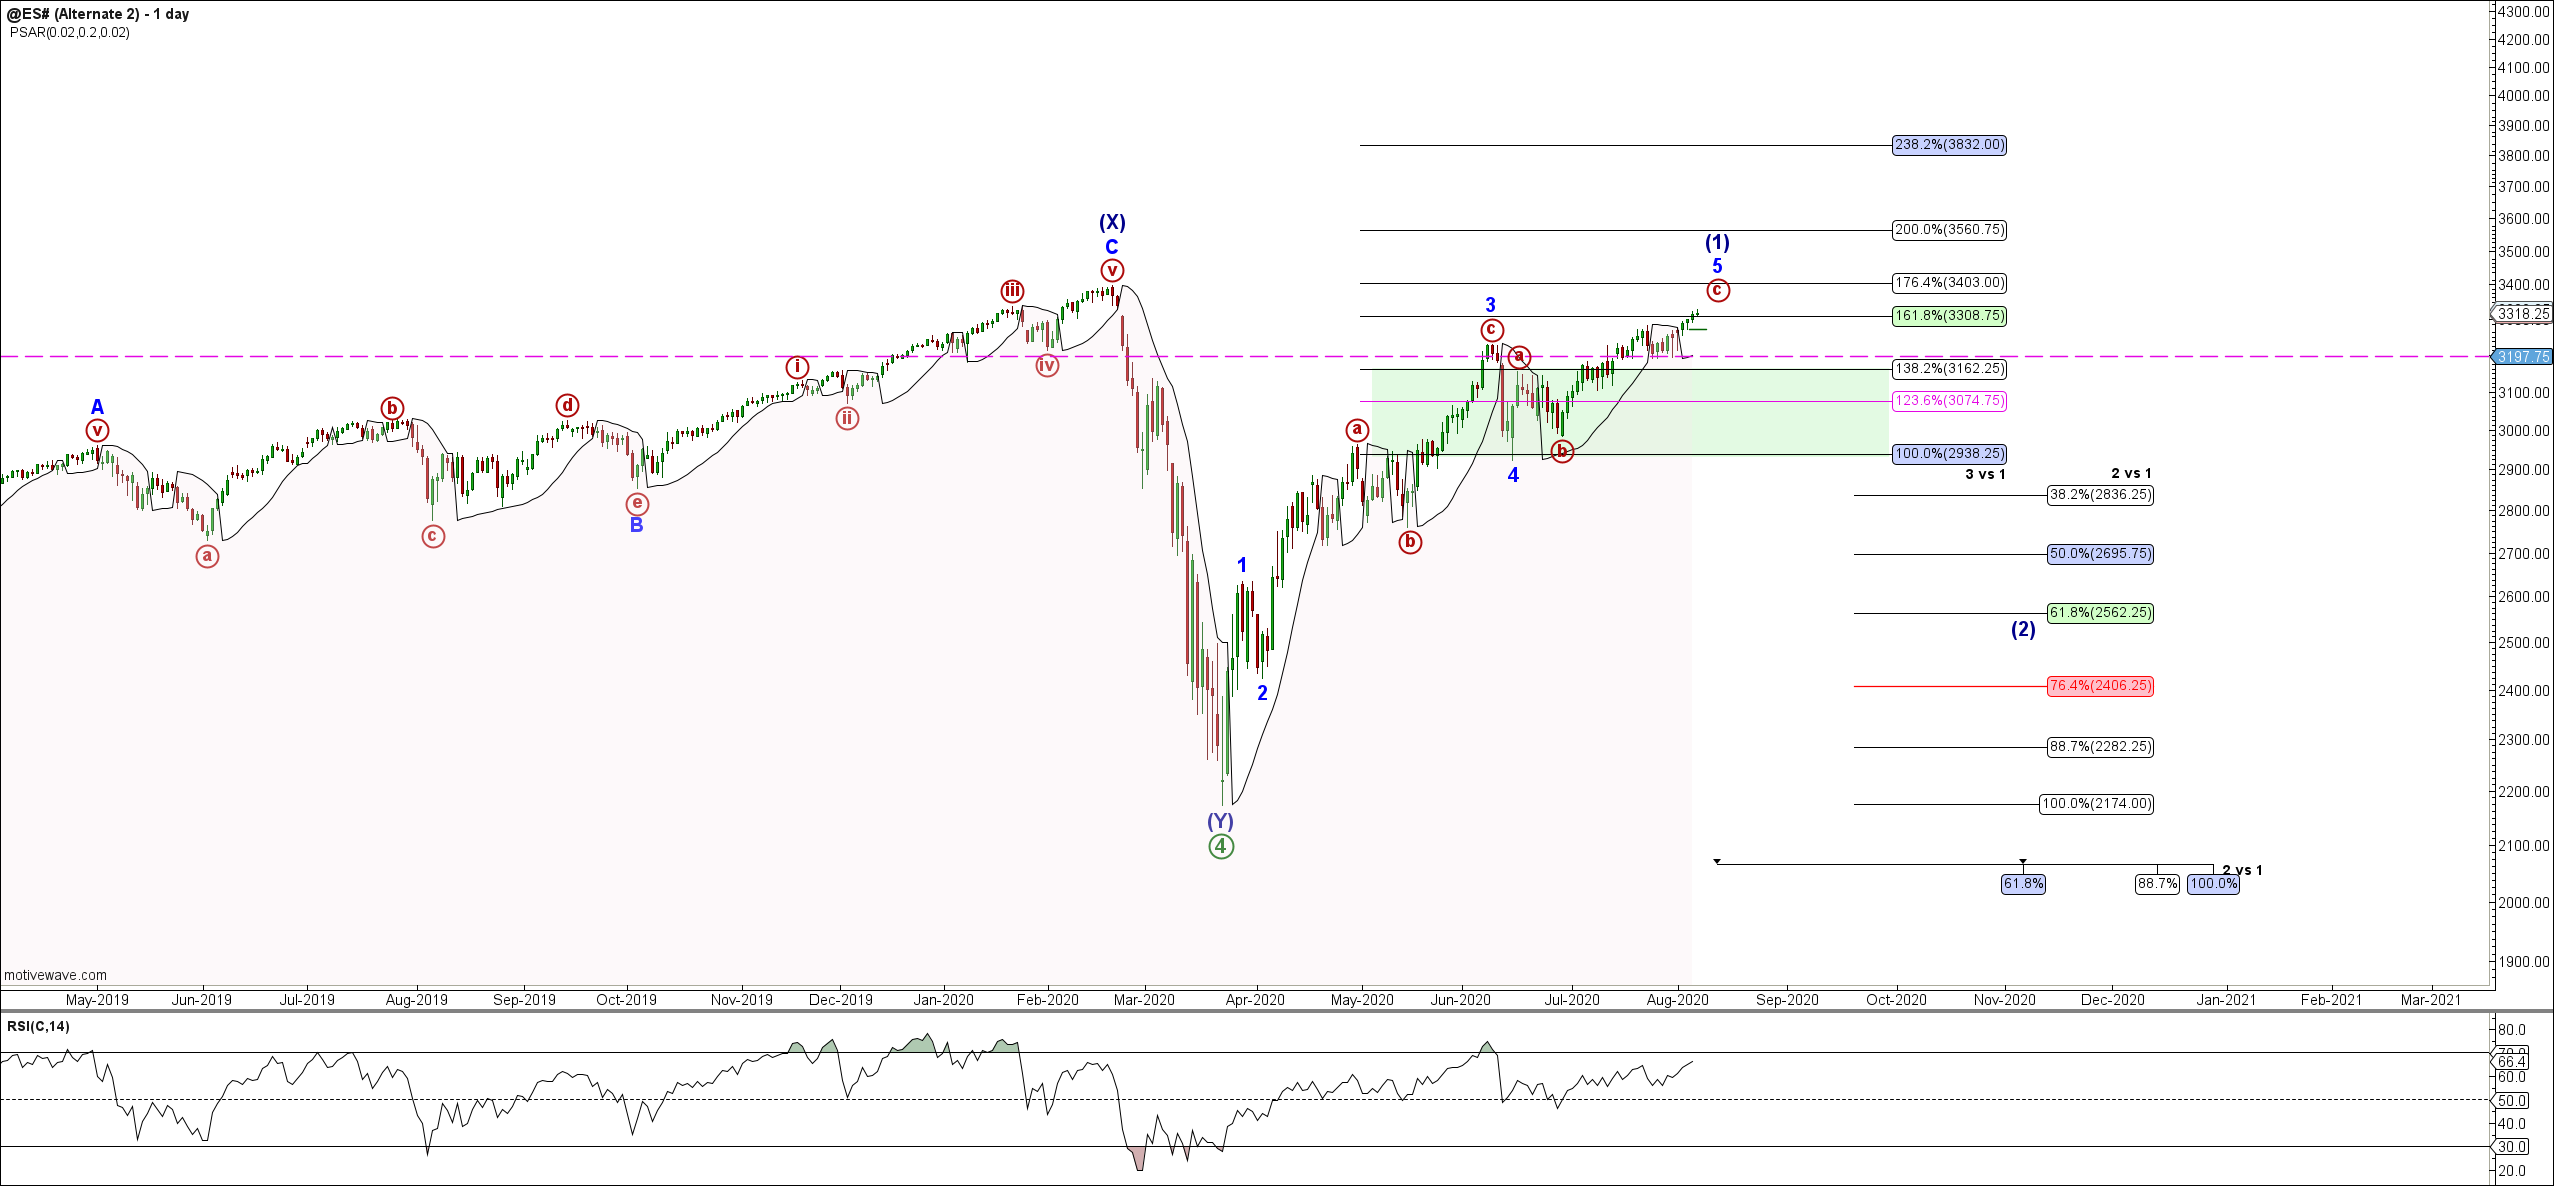
We have Non Farm Payrolls being announced before the opening bell in the US tomorrow (Friday 7th August) which often marks the commencement of a directional move in the markets so let’s take a look at where we are and what to look for over the coming weeks in the benchmark US Index Futures. 

Write comment Views: 1866 Comments: 0

Everyone is Zooming These days

Mike Richards on 04/08/2020 1354 days ago
Zoom Video Communications Inc (ZM) looks interesting to the long side again here. We first notified subscribers of the potential upside in this stock on 6th December 2019 when we took a long position at $62.02. Zoom was displaying the potential for the start of an impulse wave to the upside after a common pattern following its IPO appeared to have made a significant bottom and initial basing pattern with positively diverged RSI and a classic Daily Squeeze building that preceded a system BUY Signal.
Write comment Views: 1823 Comments: 0

Where Next For US Markets?

Mike Richards on 29/07/2020 1360 days ago

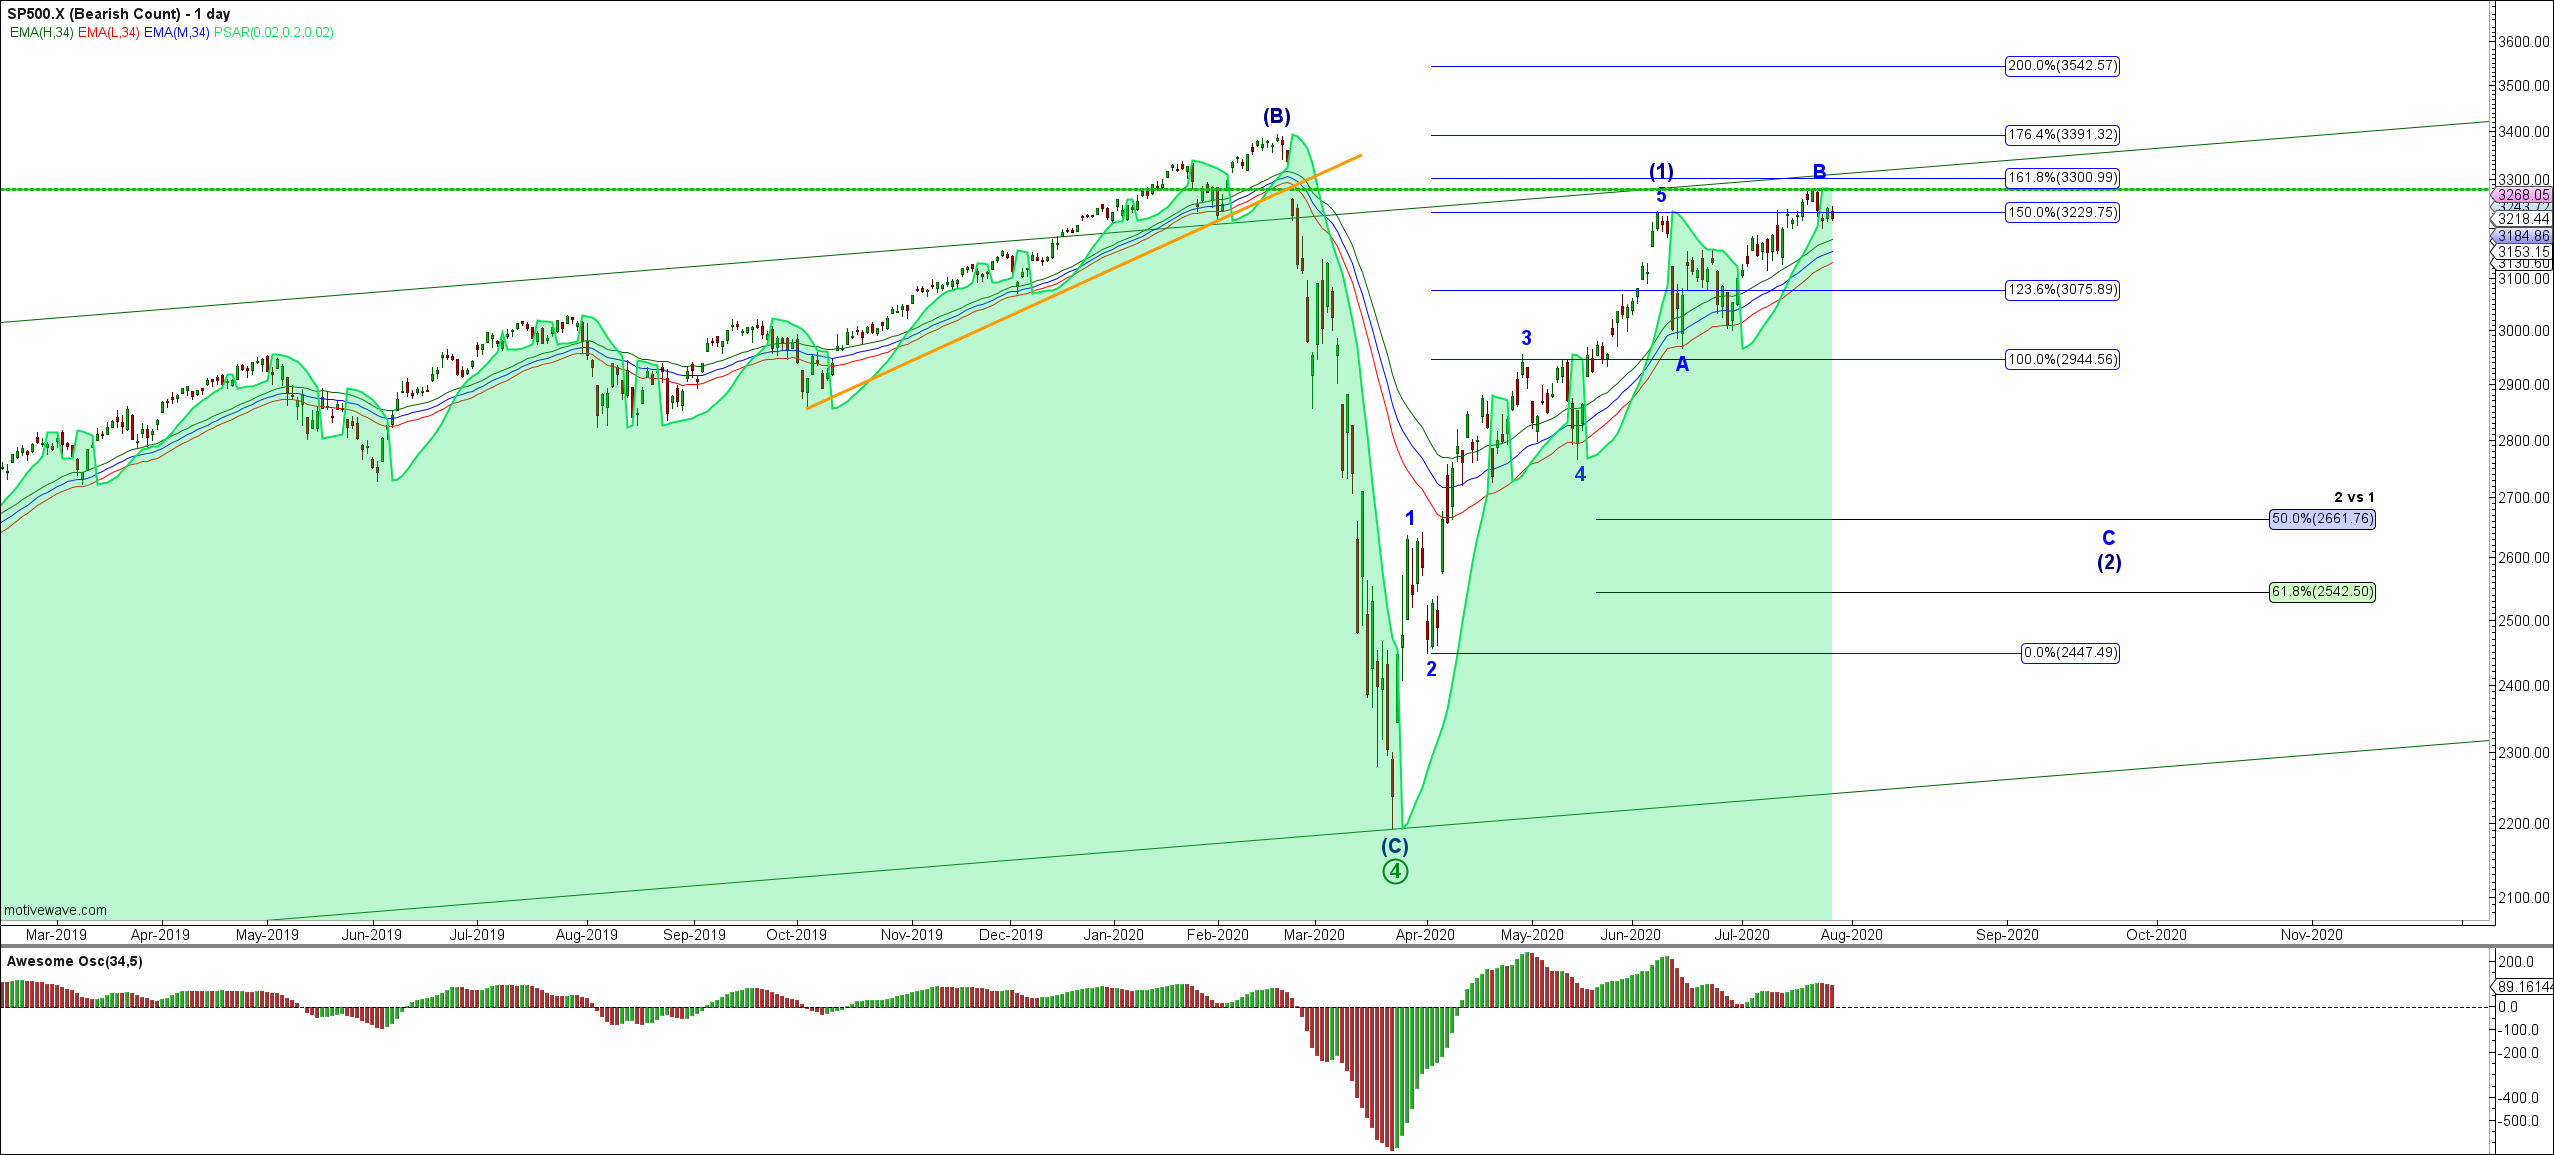
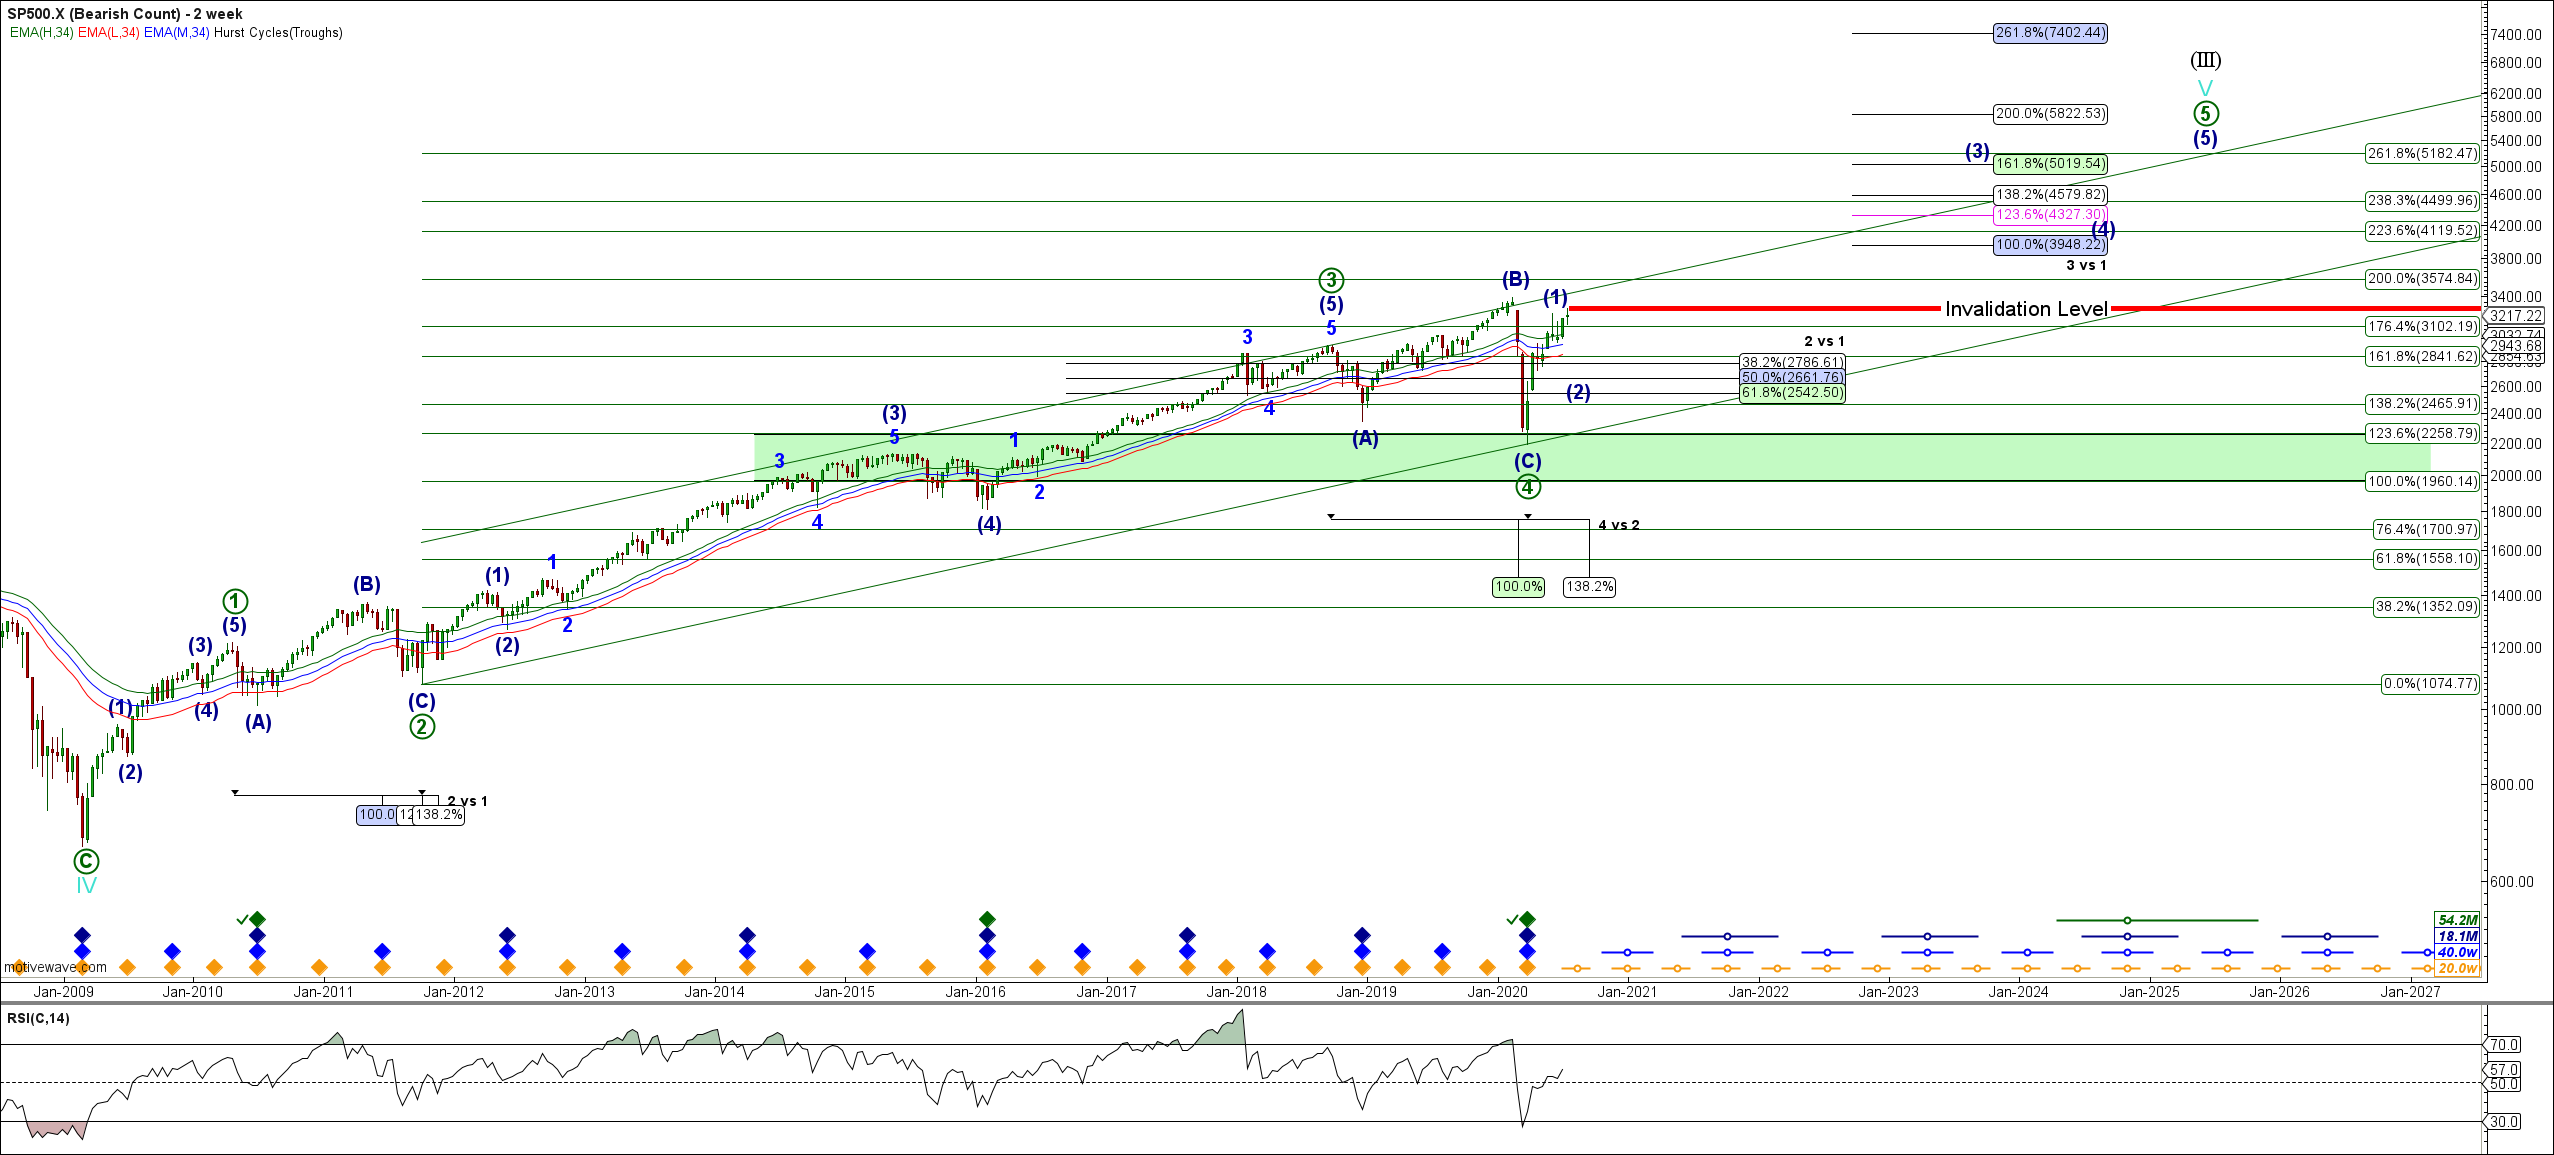
With the Main US Indices have been effectively range bound since early to mid June we are looking for the next significant directional move. Seasonally August has historically seen pullbacks in the S&P500 (See Chart). Will this unusually volatile year prove to be different? 


Write comment Views: 1748 Comments: 0

US Markets & Precious Metals Update

Mike Richards on 25/07/2020 1364 days ago

This weekend we are providing an in depth analysis of the Major US Indices, Sector ETF's and a range of Key Stocks from the TPA Site Watch List. We also take a look at the Precious Metals & Gold Miners which have made strong moves to the upside over recent months. We are providing this complimentary analysis to you as subscribers to the TPA Blog which we intend to become more active over the coming months. 

US Indices continued higher again this past week before reversing early on during Thursdays session and continuing lower into the close on Friday. In this weeks update I have covered the Indices in detail together with the Major Sector ETF's and Key Large CAP stocks that have been instrumental in driving the US Markets higher over recent weeks as well as a number of other stocks with particularly interesting set ups from the TPA site Watch Lists.

The Precious Metals and Gold Miners had another very strong week to the upside and are now approaching key levels from which we may turn lower, most likely correctively over coming months.

The Video can be view here: VideoFree

Write comment Views: 1776 Comments: 0

Looking Past This U.S. Equities Market Correction

Brian Fletcher on 16/03/2020 1496 days ago
Summary

This too will pass, and now is the time to remain completely calm, identify opportunity, and form a plan.

We were early in our forecast, but the larger time frame charts we have posted on numerous occasions are finally following through.

While this correction appears swift, from a time perspective it's not nearly over, but from a price perspective we are closer to the bottom than the top.

Write comment Views: 8023 Comments: 0

Catalysts For A Stock Market Correction - Expectations For The S&P 500

Brian Fletcher on 07/10/2019 1657 days ago
Summary

US Equities are setup in picture perfection fashion for a drop into mid to late October.

Corrections are a process where markets provide choppy indecisive behavior followed by fast and furious moves to the downside.

Equity markets may respond to new driven events, but the moves themselves are predictable well in advance.

Write comment Views: 6336 Comments: 0

Natural Gas: How To Trade The Upside

Brian Fletcher on 04/10/2019 1660 days ago
Summary

Natural gas is setting up an enormous upside move, but there are multiple ways to position for this move.

There are nuances relating to the interpretation of the pattern that relate to the front month and continuous contract price levels and lend to several different scenarios playing out.

All counts lead to higher over the longer term, but another low potential is still very much a possibility.

Write comment Views: 1745 Comments: 0

U.S. Equity Markets' Forthcoming 25% Correction - Part 4

Brian Fletcher on 01/10/2019 1663 days ago
Summary

Until the S&P 500 is able to take out the high established in late July, we are still looking to lower levels.

Corrective action is difficult, and 4th waves are the most difficult and variable patterns for investors to trade.

Our expectations for price levels and timing continue in this series relating to the forthcoming correction.  It won't happen overnight, and will take some time to unfold in it's entirety.

Write comment Views: 4578 Comments: 0

Crude Oil Price Expectations: A Thing Of Beauty

Brian Fletcher on 15/09/2019 1679 days ago
Summary

The Elliott Wave patterns for crude oil continue to adhere in picture perfect fashion to provide investors multiple high-return opportunities.

Most investors believe crude oil will either go considerably higher or considerably lower.  Over the next 12 months, they will all be right. But will they all make a profit?

This is a complex pattern for crude, and requires those who trade in the black gold to act swiftly when opportunities arise, but there are several phenomenal trades setting up.

Write comment Views: 5139 Comments: 0

U.S. Equity Market's Forthcoming 25% Correction - Part 3

Brian Fletcher on 04/09/2019 1690 days ago
Summary

The drop that occurred into August 6th caused technical damage to the equity markets that will provide a number of false starts before ultimately resolving to the downside.

Cash is a position too, and this is a time period for investors to either be in cash, fully hedged, or have short equity exposure.

Complacency and unrealistic expectations are common place characteristics of individual investors during this portion of the pattern cycle.

Write comment Views: 4448 Comments: 0

Price Targets (And Trades) For Crude Oil

Brian Fletcher on 22/08/2019 1703 days ago
Summary

Crude Oil is setting up a number of VERY attractive trades in the next 12 months.

The recent corrective price action in crude oil has made it extremely difficult for traders.

Patience with the overall crude oil Elliott Wave pattern is key right now.

Write comment Views: 1618 Comments: 0

U.S. Equities Correction Continues

Brian Fletcher on 21/08/2019 1704 days ago
Summary

More downside to persist in US equities.

Corrective market action is choppy and continues to tease market participants, but the trap door will open shortly.

Our expectations for completion of the first phase of this correction.

Write comment Views: 1948 Comments: 0

U.S. Equities Markets Forthcoming 25% Correction - Part 2

Brian Fletcher on 14/08/2019 1711 days ago
Summary

The move down in equities into the August 6th low is only the initial move of a multi-month correction that will ultimately catch many investors off guard.

The technical breakdown that occurred on the initial drop was not only foreseeable, but now portends continuation with much lower levels still to come.

The move down will not be a straight forward linear move. It is corrective market action, and along with corrective action  comes increased volatility and false starts that resolve downwards.

Write comment Views: 4481 Comments: 0

U.S. Equity Markets' Forthcoming 25% Correction

Brian Fletcher on 31/07/2019 1725 days ago
Summary

Equities are in the topping region and the risk to reward skew now favors the short side.

For investors looking to exit equities to re-enter from lower, now is the time. For those looking to hedge long equity exposure, now is the time.

Consider your risk exposure and how it relates to your overall tolerance now, and don't wait until markets have dropped 10% to do so.

Write comment Views: 6249 Comments: 0

Portfolio And Risk Management Part 1 – Learning To Minimize Losses And Maximize Profits

Brian Fletcher on 30/07/2019 1726 days ago
Summary

Understanding how our methodology fits into your ability to achieve annual super-performance.

Control risk and keep losses small, and over time performance will follow.

Setups come and go, but throughout any given year there will be a period of trade setups that allow investors to literally "mop up".

Write comment Views: 6273 Comments: 0

Bitcoin - The Ride Is Just Starting Part 4

Brian Fletcher on 24/07/2019 1732 days ago
Summary

Investors who want to own Bitcoin will have one last chance before it leaves the price station headed to significantly higher levels.

Those who ignore this sector, will live their lives as normal only to wake up one day and realize they missed the potential to increase their capital by 10 fold.

A complete impulse off the December 2018 low now sets up the next and last opportunity to long Bitcoin.

Write comment Views: 2313 Comments: 0

Trade Alert S&P 500 - Timing And Level Expectations For Initial Move Down

Brian Fletcher on 17/07/2019 1739 days ago
Summary

Expectations for the price level move down in the S&P 500 through November, 2019.

Timing expectations for the initial move down.

Now is a good time to exit or hedge long exposure and consider short exposure to the S&P 500.

Write comment Views: 4603 Comments: 0

Bond Prices Set To Fall - Dreaded Rising Interest Rates Is Nigh Upon Us

Brian Fletcher on 14/07/2019 1742 days ago
Summary

Long-term interest rates are setting up for a significant rise, and the implications could be staggering.

Investors have grown complacent with lower rates, and how quickly they forget the effect that escalating rates have to the underlying value of their bonds and total return.

An intermediate term opportunity to short bonds is setting up nicely.

Write comment Views: 4542 Comments: 0

Gold Down And The U.S. Dollar Up

Brian Fletcher on 03/04/2019 1844 days ago
Summary

The pattern suggests the USD will rise into this summer.

The pattern in gold and the miners sector suggests lower movement into this summer.

We have solid price targets and a number of key clues to suggest when and how we will go long the precious metals mining sector.

Analysis and investors alike have grown frustrated by the sectors continued false breakouts. Hold on, it's about to happen again.

Write comment Views: 3300 Comments: 0

S&P 500 Continues To Push - But Not For Long

Brian Fletcher on 03/04/2019 1844 days ago
Summary

Still expecting a move to the 2200 SPX level.

Price targets for the upside before rolling over to the lower levels.

Hurst Timing projections for the next 3 moves that are part of this correction.

Write comment Views: 4209 Comments: 0

S&P 500 - Has It Topped?

Brian Fletcher on 26/03/2019 1852 days ago
Summary

The S&P topped this past Thursday into the target region and reversed sharply.

What are the key levels the S&P 500 needs to break to confirm the top is in? We'll review those below.

An in depth video coverage that reveals the longer time frame expectations.

Write comment Views: 1759 Comments: 0

Trade Alert: Crude Oil Setting Up For Continued Upside

Brian Fletcher on 18/03/2019 1860 days ago
Summary

March 8th offered a picture perfect entry long into crude oil at $54.52 with an upside price target of $63.80 to $73, with the higher side more likely.

If you missed the entry on March 8th, crude oil prices might offer one more chance to board the train before leaving the station.

Know the entry and stop out or invalidation level in advance of going long in order to minimize risk.

Write comment Views: 4680 Comments: 0

Trade Alert: S&P 500 - Setting Up For Downside

Brian Fletcher on 14/03/2019 1864 days ago
Summary

The S&P 500 is approaching our target region before a turn down.

Upon completion to the upside, there are two potential downside targets. We favor the lower levels into the 2,200 region next.

For those seeking to exit equities and buy back 15% - 25% lower, in this article I discuss levels to exit and re-enter.

Write comment Views: 6649 Comments: 0

Gold And Precious Metals - Another False Breakout?

Brian Fletcher on 08/03/2019 1870 days ago
Summary

After gold's move up from its September 2018 low, remaining patient a while longer should provide an even better entry point for the sector.

Lower levels into the $1,112 region in gold and the $15.50 region in GDX are still very much in the cards.

We will be watching the retracement levels closely on the next pull back.

Write comment Views: 4799 Comments: 0

Trade Alert - Crude Oil, What's Next For The Black Gold

Brian Fletcher on 24/02/2019 1882 days ago
Summary

Crude oil long setup with high reward relative to risk.

Watch for a pullback into the $54 - $52.31 region for a long entry.

Do not chase price or over-allocate capital to any given opportunity, there are always plenty to choose from.

Write comment Views: 4650 Comments: 0

Bitcoin And Ethereum - Is The Low In?

Brian Fletcher on 20/02/2019 1886 days ago
Summary

Bitcoin and Ethereum came into our target zone and are now bouncing nicely.

While the low could be in, we still favor lower to come after a larger bounce concludes the upside.

Fundamentals are interesting, but using sentiment manifested in Fibonacci price targets is the only way to determine support and entries into cryptocurrencies.

Write comment Views: 1758 Comments: 0

S&P 500 Resolves To The Upside - But Not For Long

Brian Fletcher on 14/02/2019 1892 days ago
Summary

Upside in the S&P 500 is limited before a pullback occurs.

All three of the most probable scenarios resolve to the downside.

If you are looking to go long, be patient, better days will come.

Write comment Views: 6490 Comments: 0

S&P 500 In The Target Zone - What's Next?

Brian Fletcher on 10/02/2019 1896 days ago
Summary

The S&P 500 came right into our target zone and reversed.

Investing is about being patient and preserving your capital to take advantage of high confidence opportunities.

Where the S&P 500 is going from here and how to position for outsized gains.

Write comment Views: 1646 Comments: 0

Trade Alert - Natural Gas Is Setting Up For Huge Upside

Brian Fletcher on 05/02/2019 1901 days ago
Summary

Natural Gas is setting up for a low in the coming days to several weeks.

Upside potential is double the entry with a very favorable risk to reward skew.

Entry levels into UNG using Natural Gas as a proxy for the entry.

Write comment Views: 4754 Comments: 0

McEwen Mining: Upside And The Precious Metals Mining Sector

Brian Fletcher on 30/01/2019 1907 days ago
Summary

There are many miners to choose from, but forming a portfolio comprised of miners with the strongest fundamentals affords the most upside.

McEwen Mining, Inc., CEO Rob McEwen is a known quantity who has plenty of his own skin in the game, and who only benefits when MUX shares perform.

MUX offers two scenarios - Bullish and Very Bullish, both sharing the same entry price level.

Prepare your portfolio list now, and have a plan on how you intend to take advantage of this sector opportunity.

Write comment Views: 4609 Comments: 0

Crude Oil - High Confidence Trade Setting Up

Brian Fletcher on 30/01/2019 1907 days ago

Summary

Crude Oil setting up a 45% - 65% upside non-leveraged trade.

When two Elliott Wave counts both project in the same direction for a significant amount of price movement, it enhances the risk to reward skew dramatically in our favor.

It doesn't take too many of these types of investment opportunities each year to make a profound difference on achieving super performance.

Write comment Views: 5782 Comments: 0

Using Leveraged ETFs With The Precious Metals Miners Sector

Brian Fletcher on 28/01/2019 1909 days ago
Summary

The use of leveraged ETFs in the precious metals miners sector can be lucrative, but only as a component to an overall plan.

Leverage introduces a number of key decisions about entry and exit, and emotional decisions that one needs to consider well ahead of their trade entry.

Don't book a bareboat trip with old friends to the British Virgin Islands until after profits are converted to cash.

Write comment Views: 4678 Comments: 0

S&P 500: An Investor And Traders Guide For The Coming Months

Brian Fletcher on 24/01/2019 1913 days ago
Summary

The S&P 500 is setting up for extreme moves in 2019.

Extreme machinations in price offer investors opportunities for extreme profits.

Don't be afraid to exit positions and don't suffer from the "fear of missing out" syndrome.

In this article, I'll discuss the two primary paths for the coming machinations in the S&P 500 Stock Index and a view of how active investors and traders position to minimize losses and maximize profits.


Write comment Views: 4647 Comments: 0

Miners And Metals - Patience Is The Key

Brian Fletcher on 24/01/2019 1913 days ago
Summary

Be patient and await the "right" entry in the precious metals miners sector.

Gold and the HUI Gold BUGS Index likely to see lower into mid-2019.

Protect your capital and limit loss of emotional currency by entering correctly into this sector.

Write comment Views: 1669 Comments: 0

Bitcoin - Hold On - The Ride's Just Starting Part 2

Brian Fletcher on 19/12/2018 1948 days ago
Summary

Bitcoin has hit the Buy Zone!

Don't get caught up in the fundamentals of digital currencies, it's just a trade.

4 steps to huge returns, but keep exposure small, it won't take much capital to make huge returns.

Write comment Views: 5006 Comments: 0

Bitcoin Elliott Wave & Fibonacci Charts & Video 30th Nov. 2018

Mike Richards on 30/11/2018 1967 days ago

Bit Coin Charts & Morning Update & Video

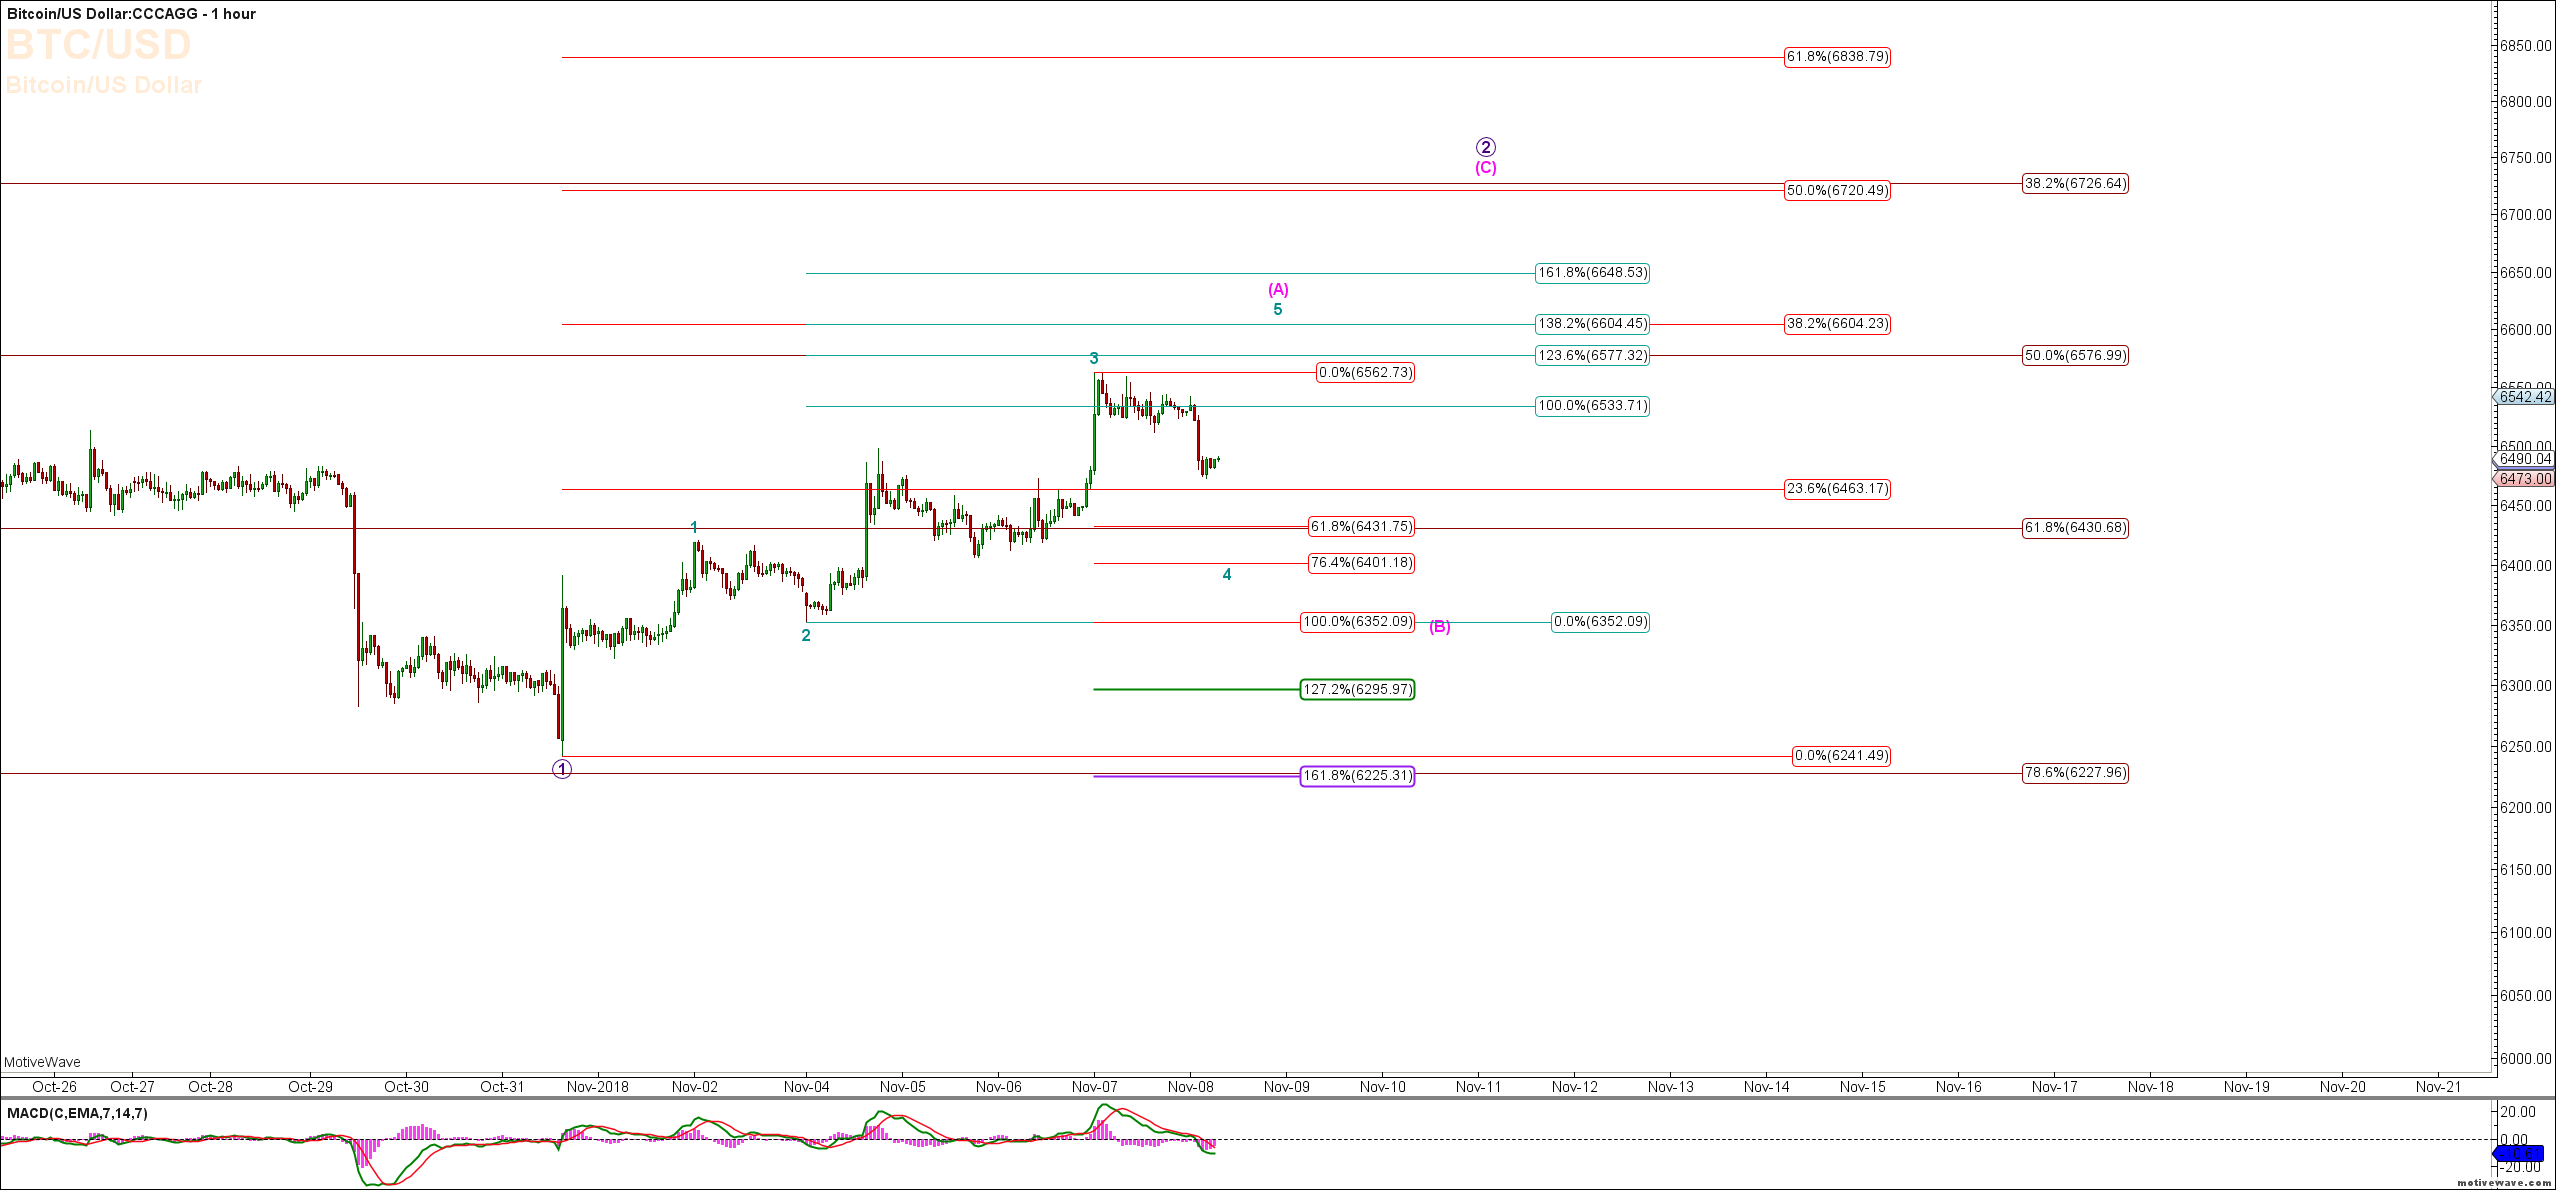
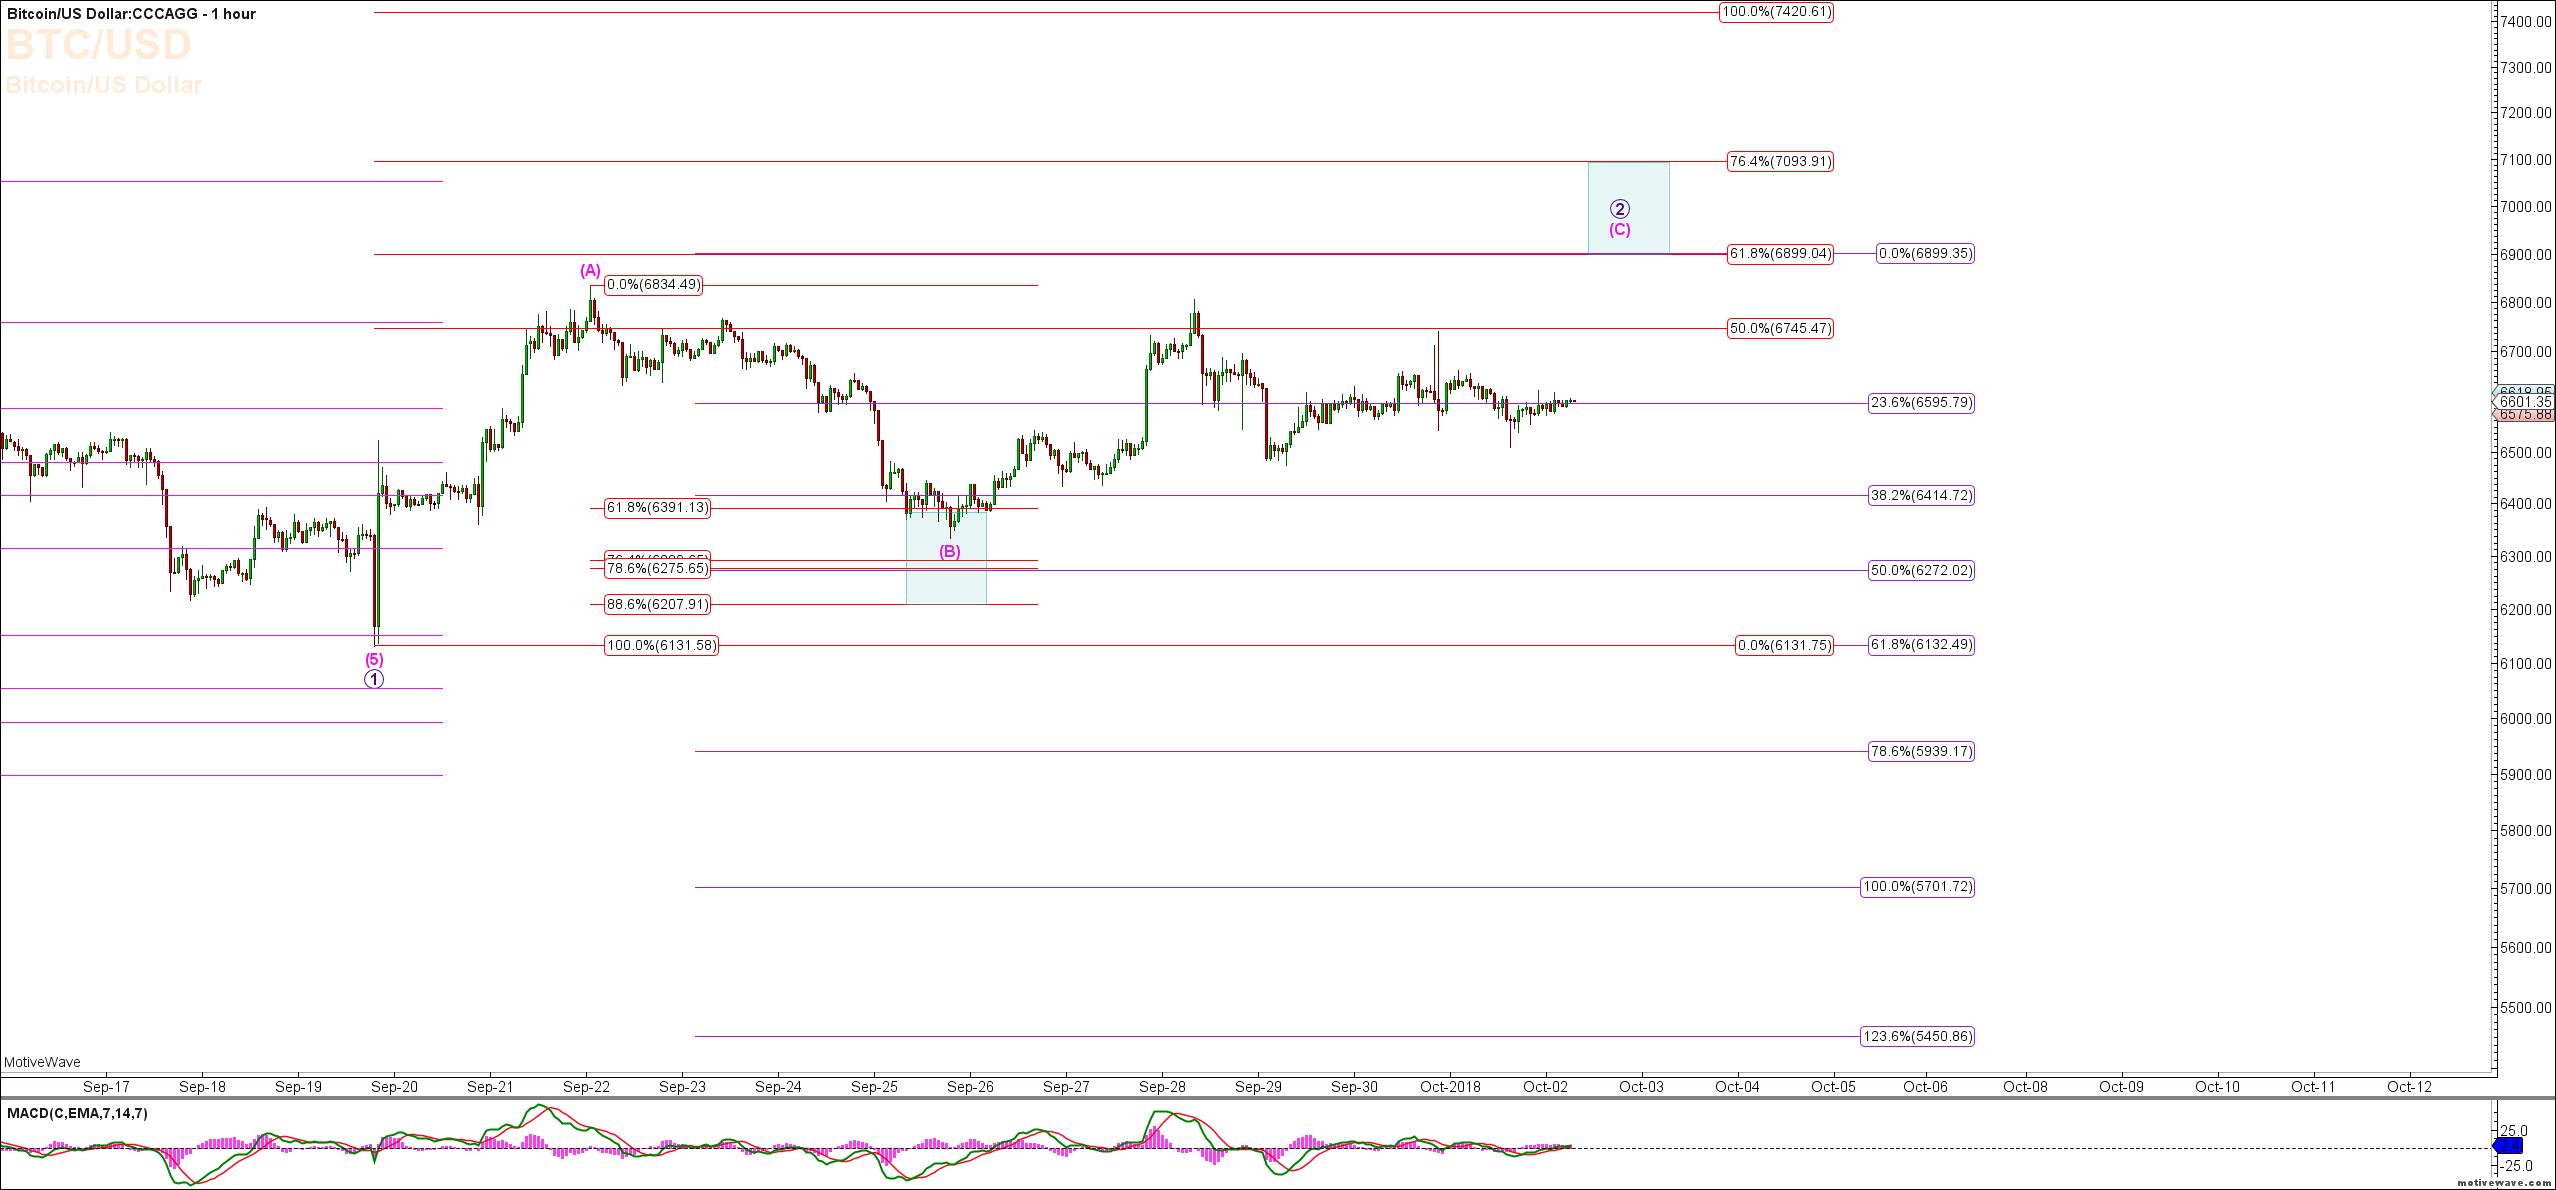
Bit coin has now completed a full five wave move down off the Sub Minuette Degree b Wave high seen on 4th September. The move down should be the Micro Degree Wave 1 of the Sub Minuette Degree wave C and the subsequent upside reversal is the Micro Degree Wave 2.

Bitcoin has turned up strongly off the low seen last week to stick save ihe Sub Micro Degree Wave (c) of the Micro Degree Wave 2 and has since hit the target zone shown in the 60 & 240 Minute Chart and reversed lower thus likely completing this Micro Degree Wave 2 Looking for Bit Coin to conform this now by taking out 6170 then 6134 next...

Write comment Views: 4768 Comments: 0

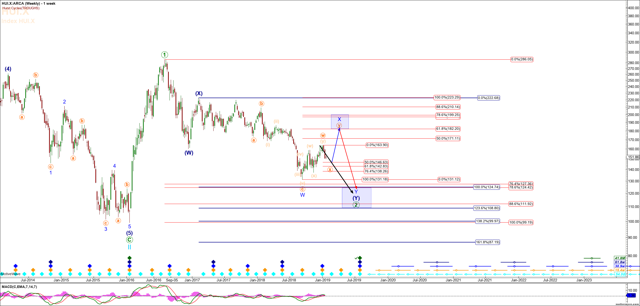
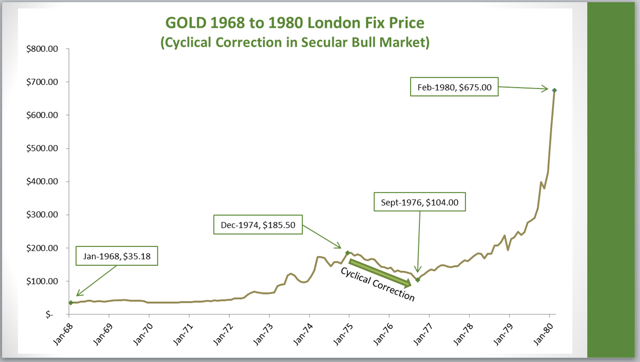
Gold: History Is Repeating Itself - Time To Listen To The Buy Bell

Brian Fletcher on 29/11/2018 1968 days ago
Summary

A clear correlation in gold price now to that of the 1970s.

The time for investors to take action is nigh upon us now.

Industry consolidation is a tell tale sign of a sector low.

Write comment Views: 4713 Comments: 0

S&P 500 Elliott Wave & Fibonacci Charts & Video Update

Mike Richards on 27/11/2018 1970 days ago

ES Charts & Morning Update

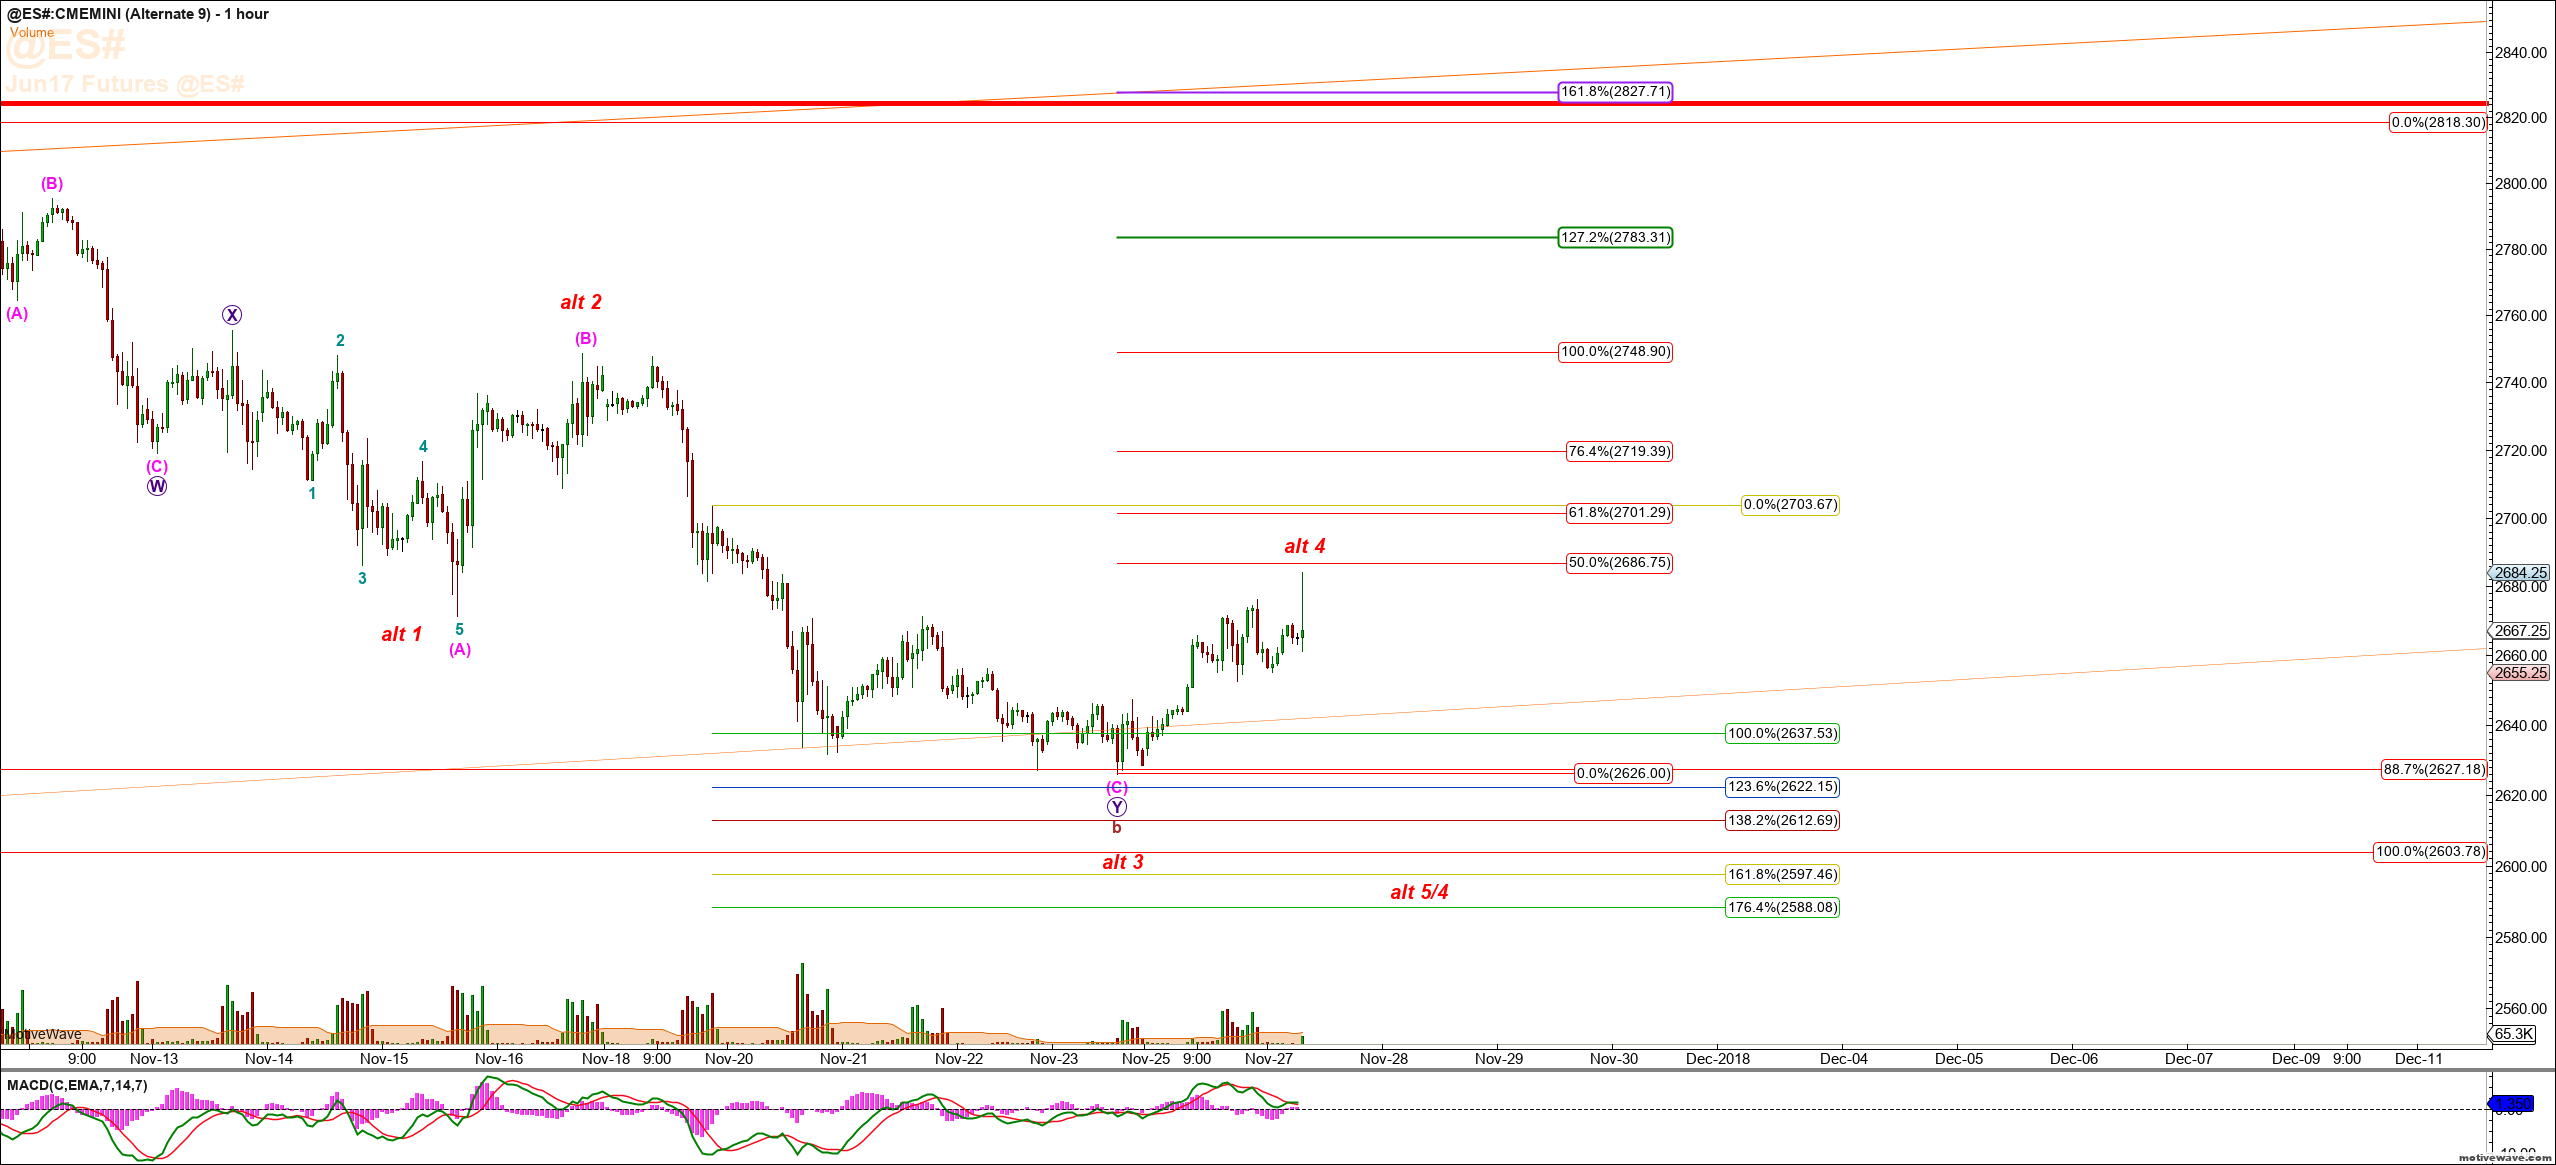
The recent low in the ES at 2605 came just shy of hitting the 1.00 extension at ES 2600 for the entire move down off the recent ATH. Since that low we have now seen ES make a strong move to the upside. IF we have now seen the swing low for this move down in the ES then we now need to see it clear the resistance zone (2770 - 2862) shown in the Daily Chart .Below there 2824 is the key pivot now in the ES and while we are below that level we can still see further declines into the support zone shown in the 60 Minute chart.

Write comment Views: 4896 Comments: 0

Crude (CL) & Natural Gas (NG) Elliott Wave & Fibonacci Charts & Video

Mike Richards on 16/11/2018 1981 days ago

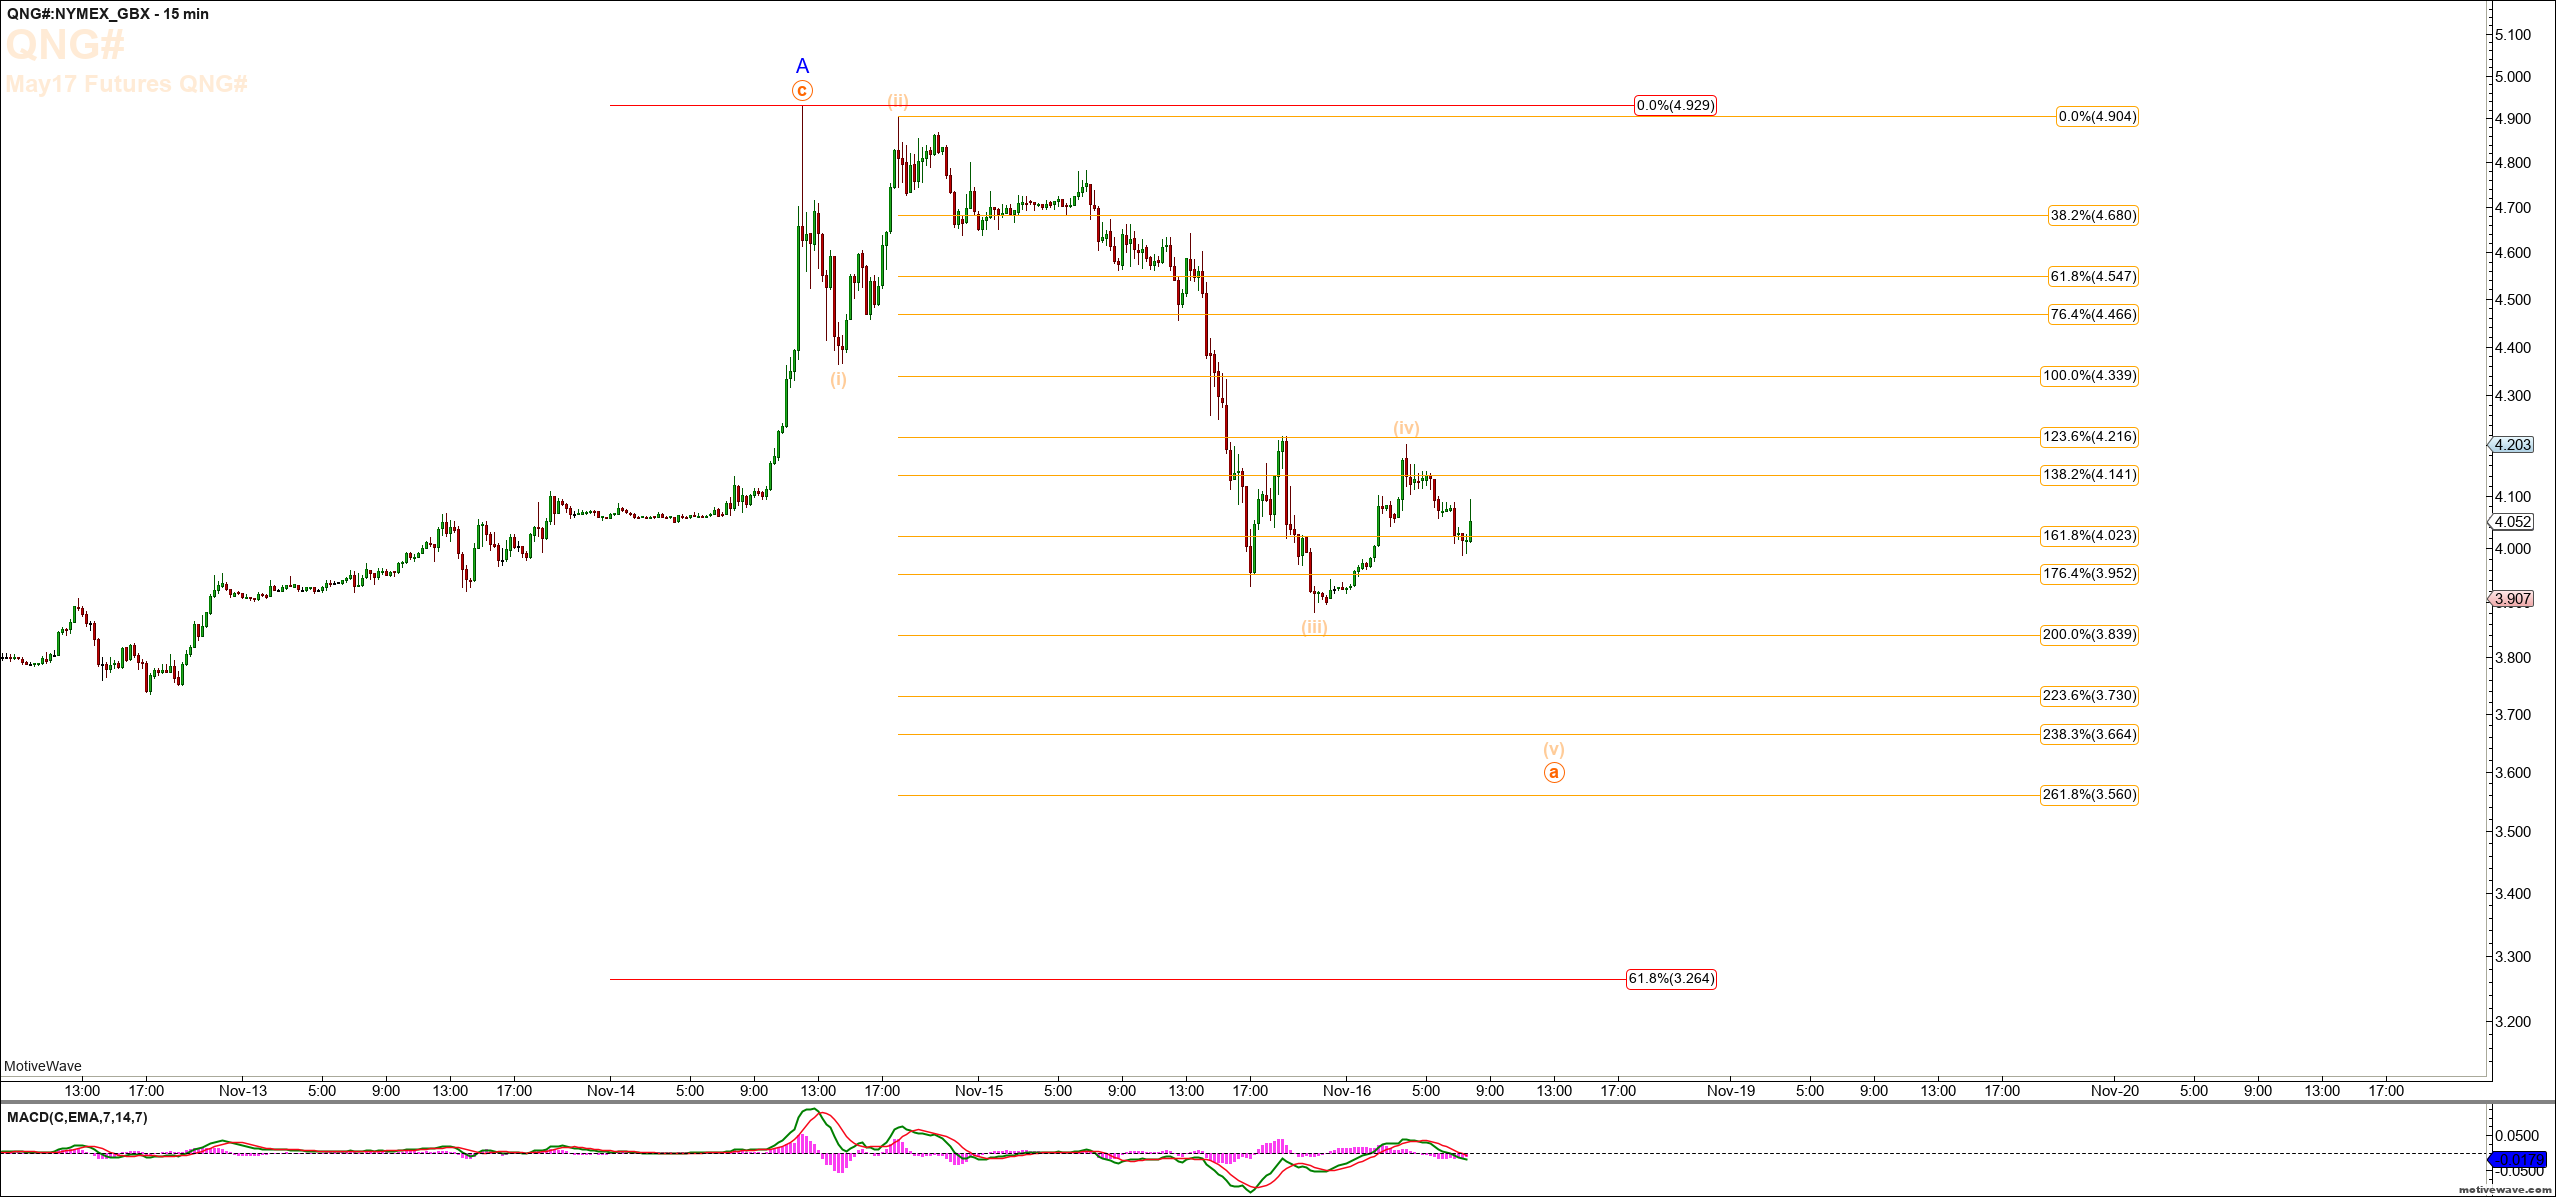
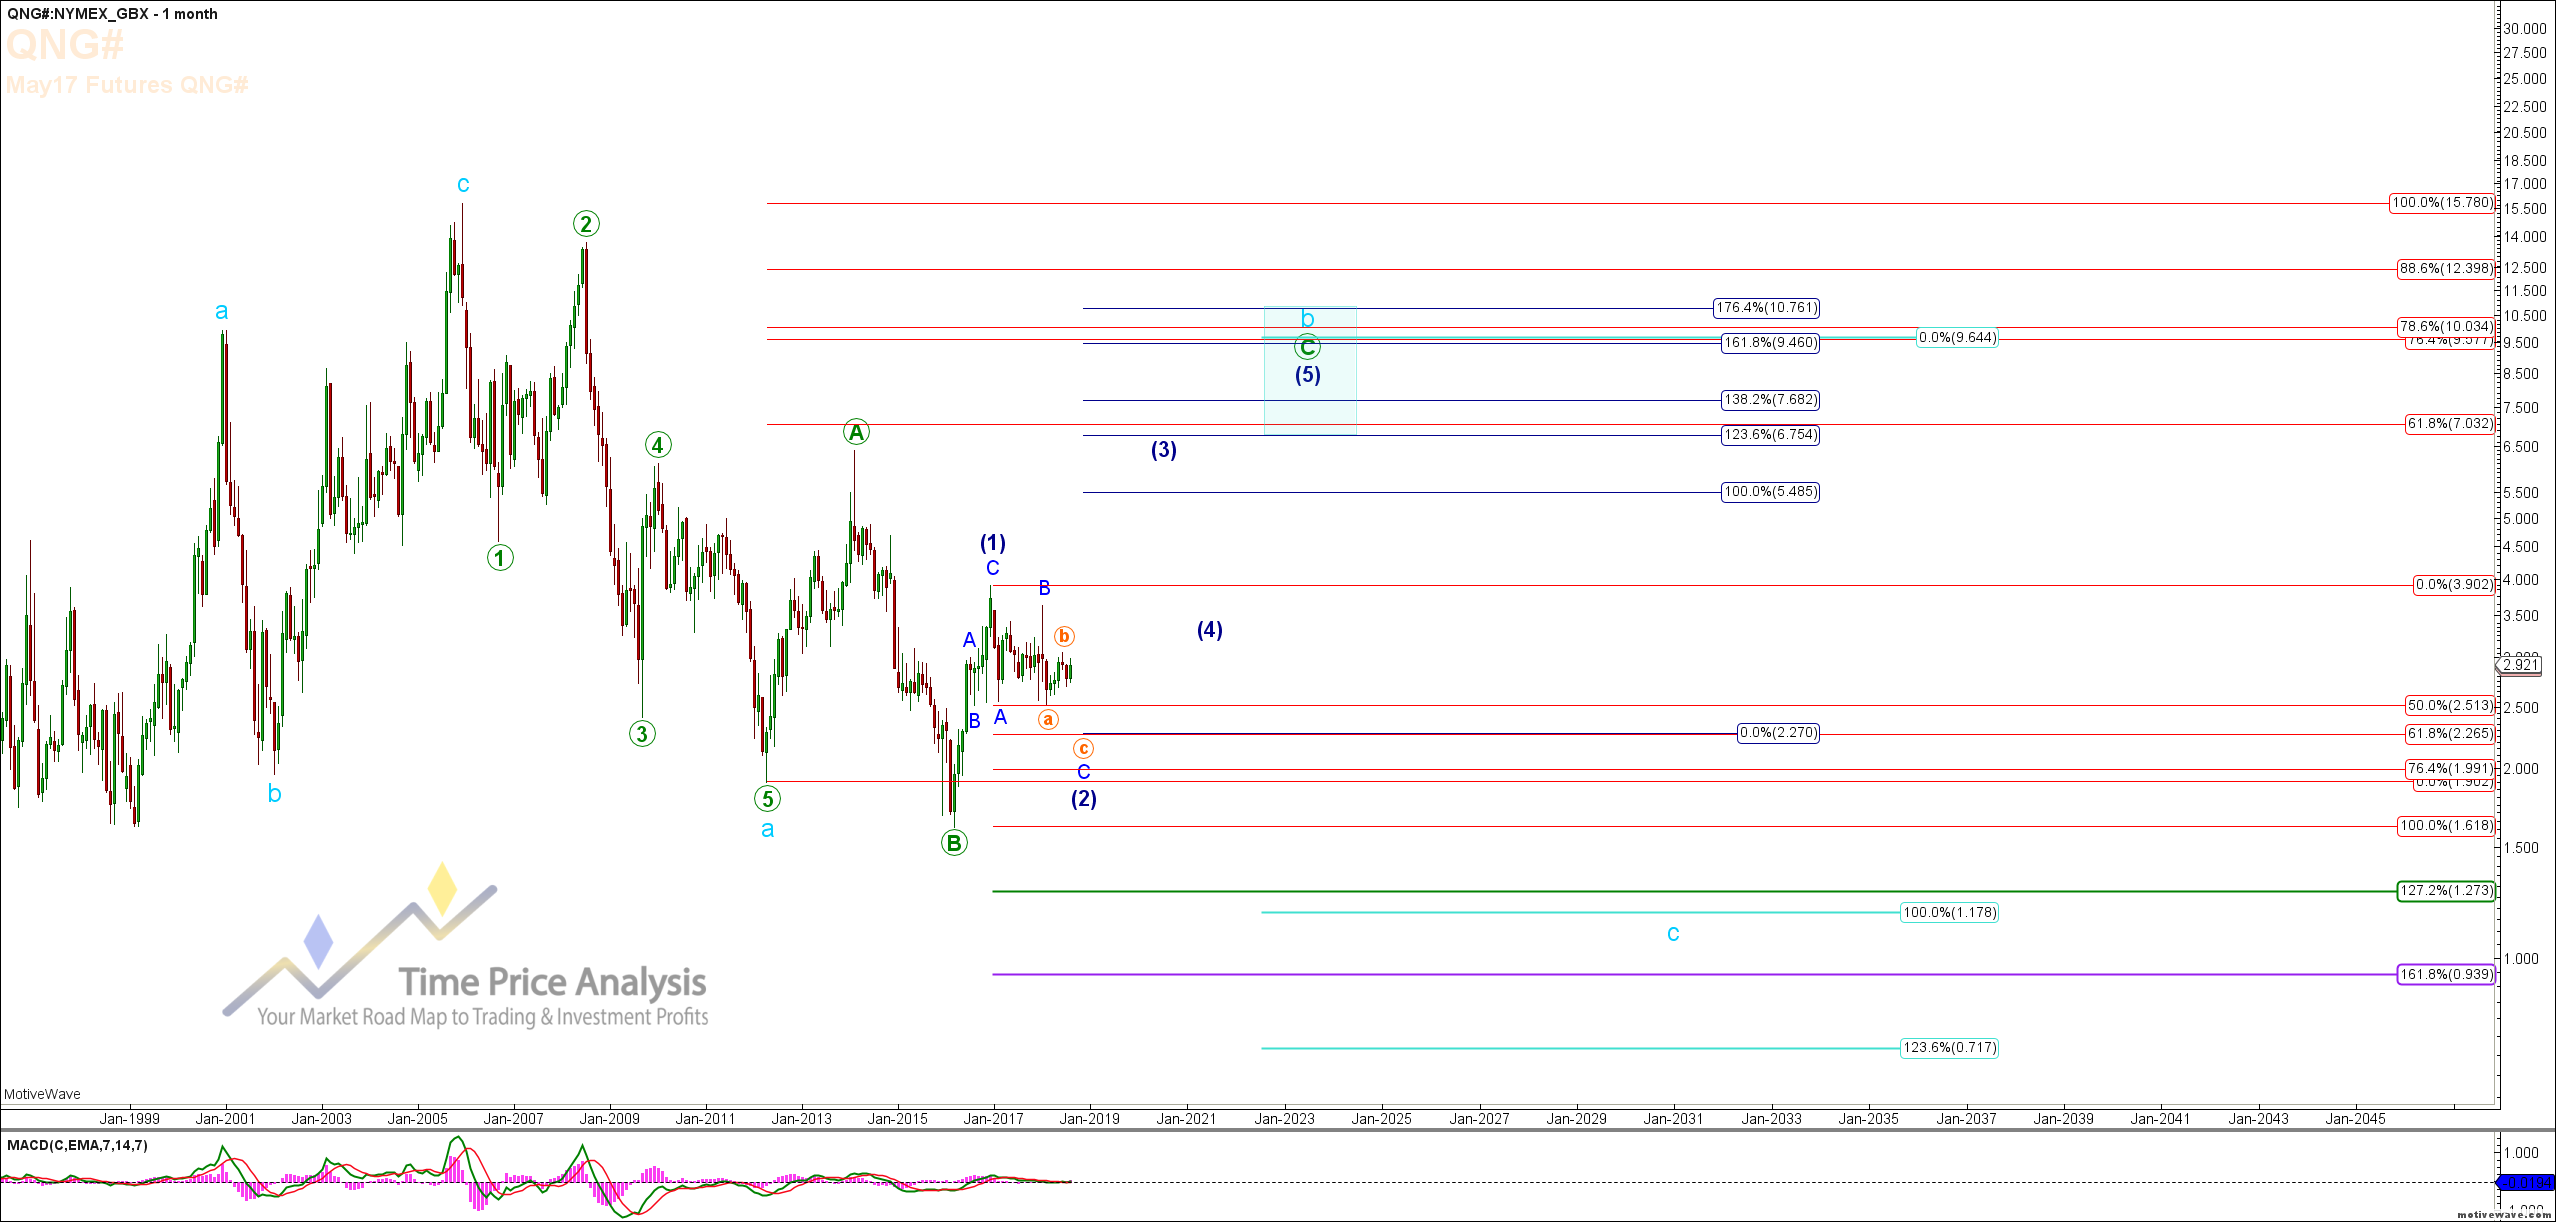
NG has continued to push gradually higher after the large gap up the other week. We have now reached the 123.6% for the a to C wave relationship in the Wave V of what looks to be a diagonal structure. We will need to see a full 5 wave move down with a subsequent retrace and follow through lower before a local high can be considered in and then assess the next move lower for likely levels. It is now more likely that this entire move up is the Minor Degree Wave A of the larger Degree Wave (3) (See daily Chart) and that the next move down will therefore be corrective.

Write comment Views: 4683 Comments: 0

Bitcoin Elliott Wave & Fibonacci Charts & Video Update

Mike Richards on 08/11/2018 1989 days ago

Bit Coin Charts & Morning Update:


Bit coin has now completed a full five wave move down off the Sub Minuette Degree b Wave high seen on 4th September. The move down should be the Micro Degree Wave 1 of the Sub Minuette Degree wave C and the subsequent upside reversal is the Micro Degree Wave 2

Write comment Views: 4875 Comments: 0

EURUSD Charts & Updated Elliott Wave & Fibonacci with Video

Mike Richards on 05/11/2018 1992 days ago

EURUSD Charts & Morning Update

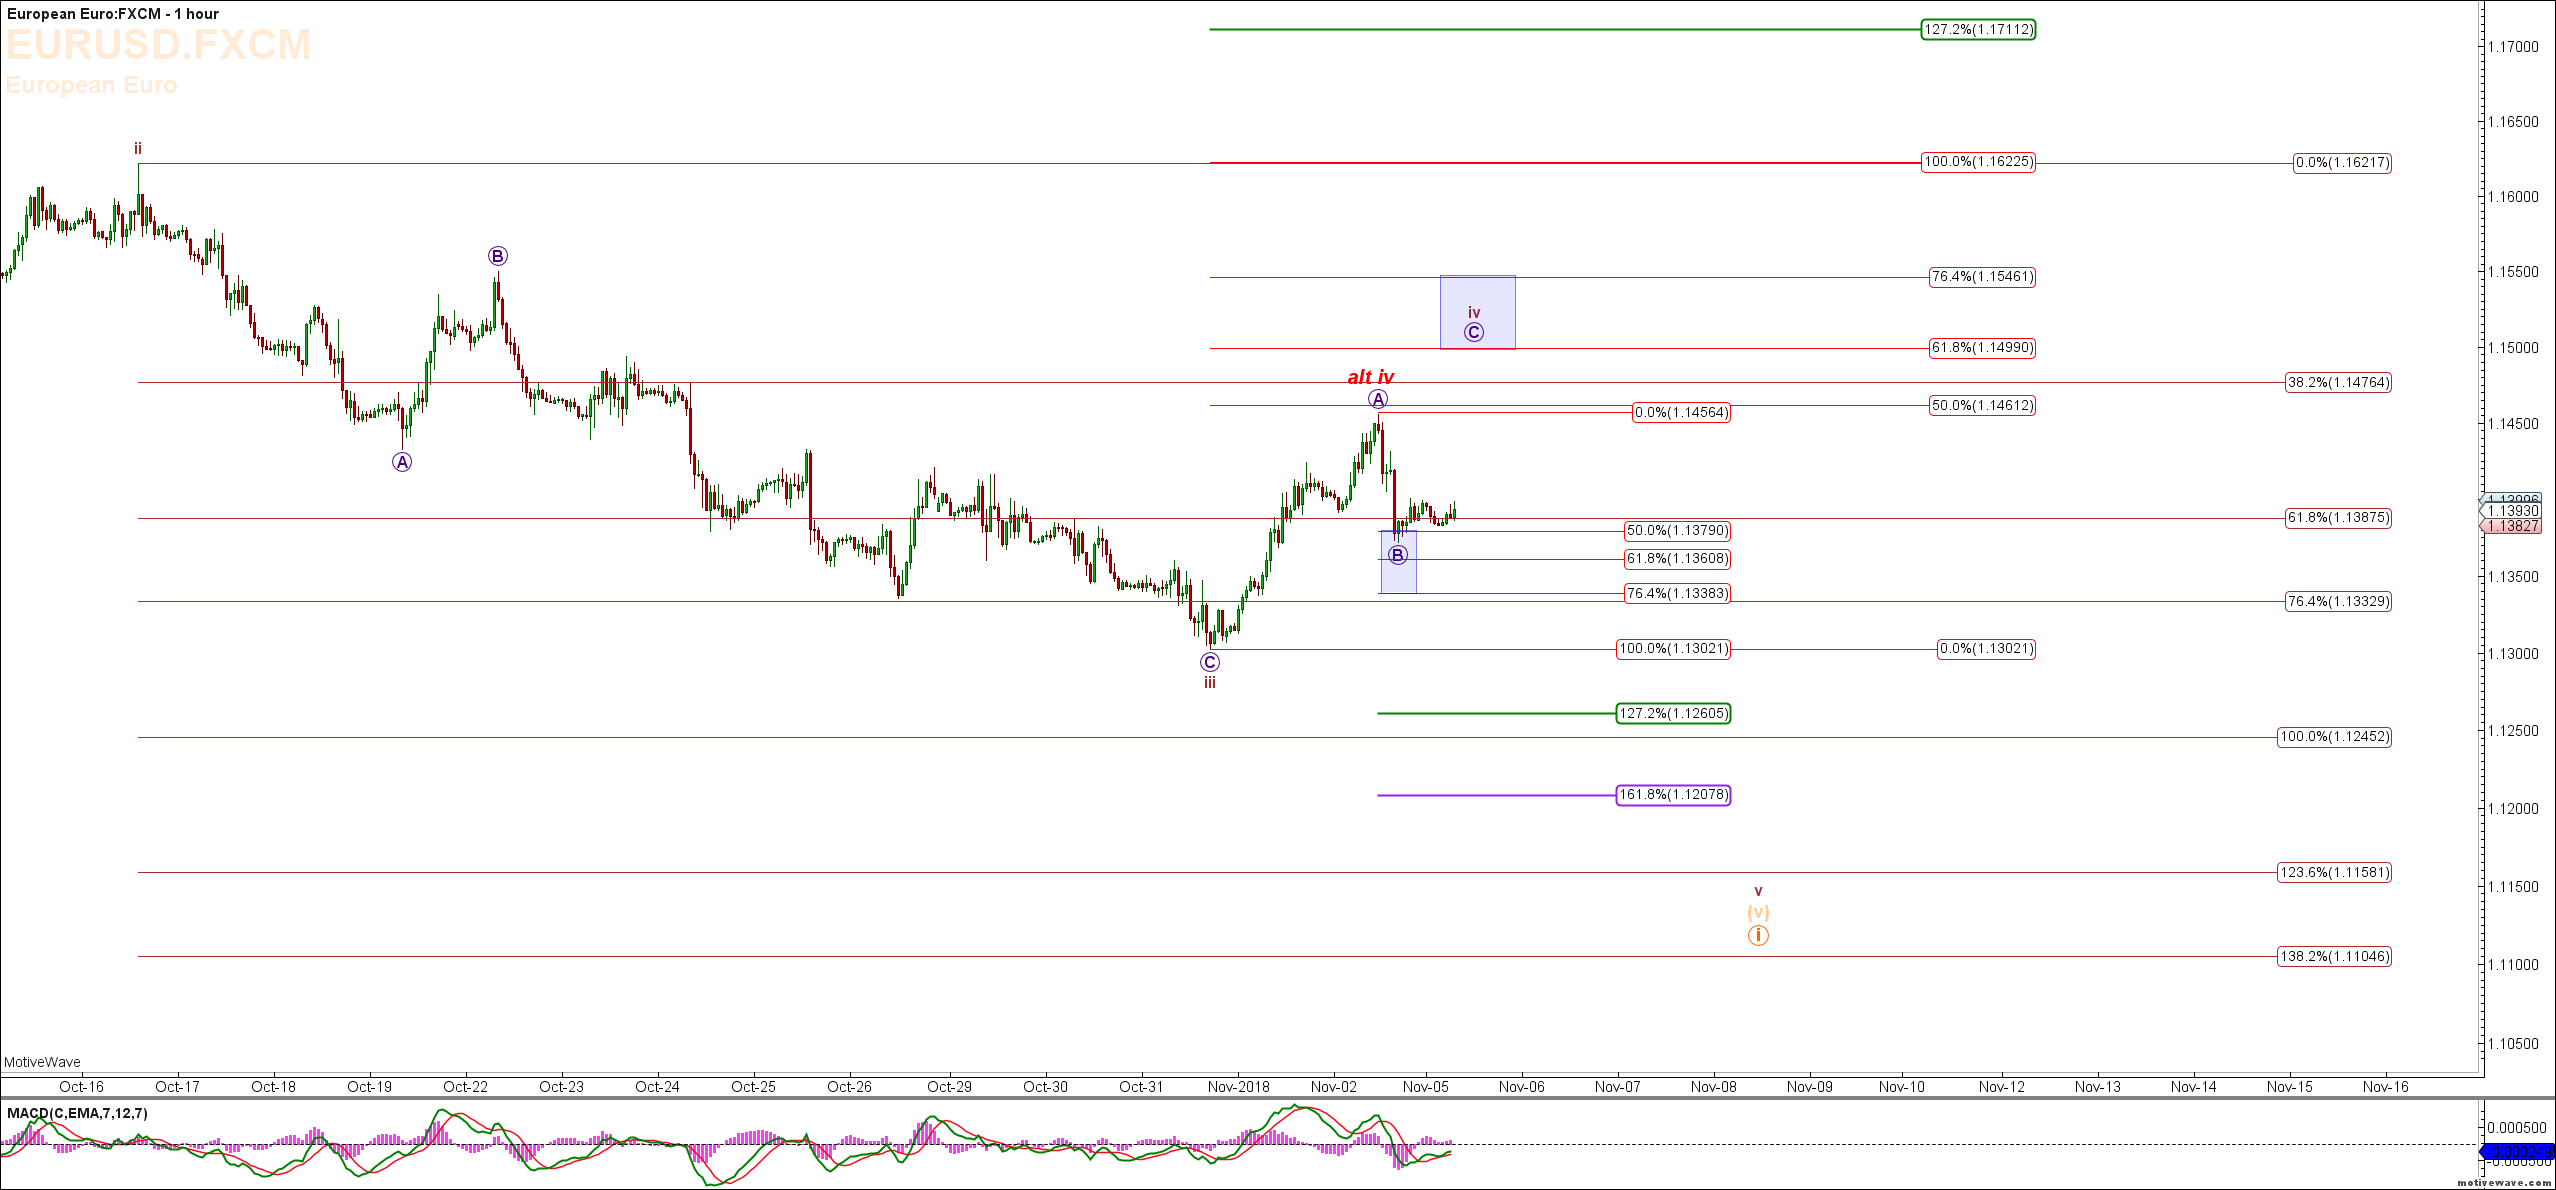
With the continued move higher in the EURUSD it is now un clear if we are still in a Minuette Degree wave (IV) with the Minuette Degree wave (5) sill ahead to complete all of the Minute Degree Wave 1 down off the February 2018 high OR we are now in the Minute Degree Wave II back up already with the Minute Degree wave 1 having completed at the August 15th low. 

Write comment Views: 4853 Comments: 0

S&P 500 (ES) Elliott Wave & Fibonacci Charts & Video

Mike Richards on 31/10/2018 1997 days ago

ES Charts & Morning Update

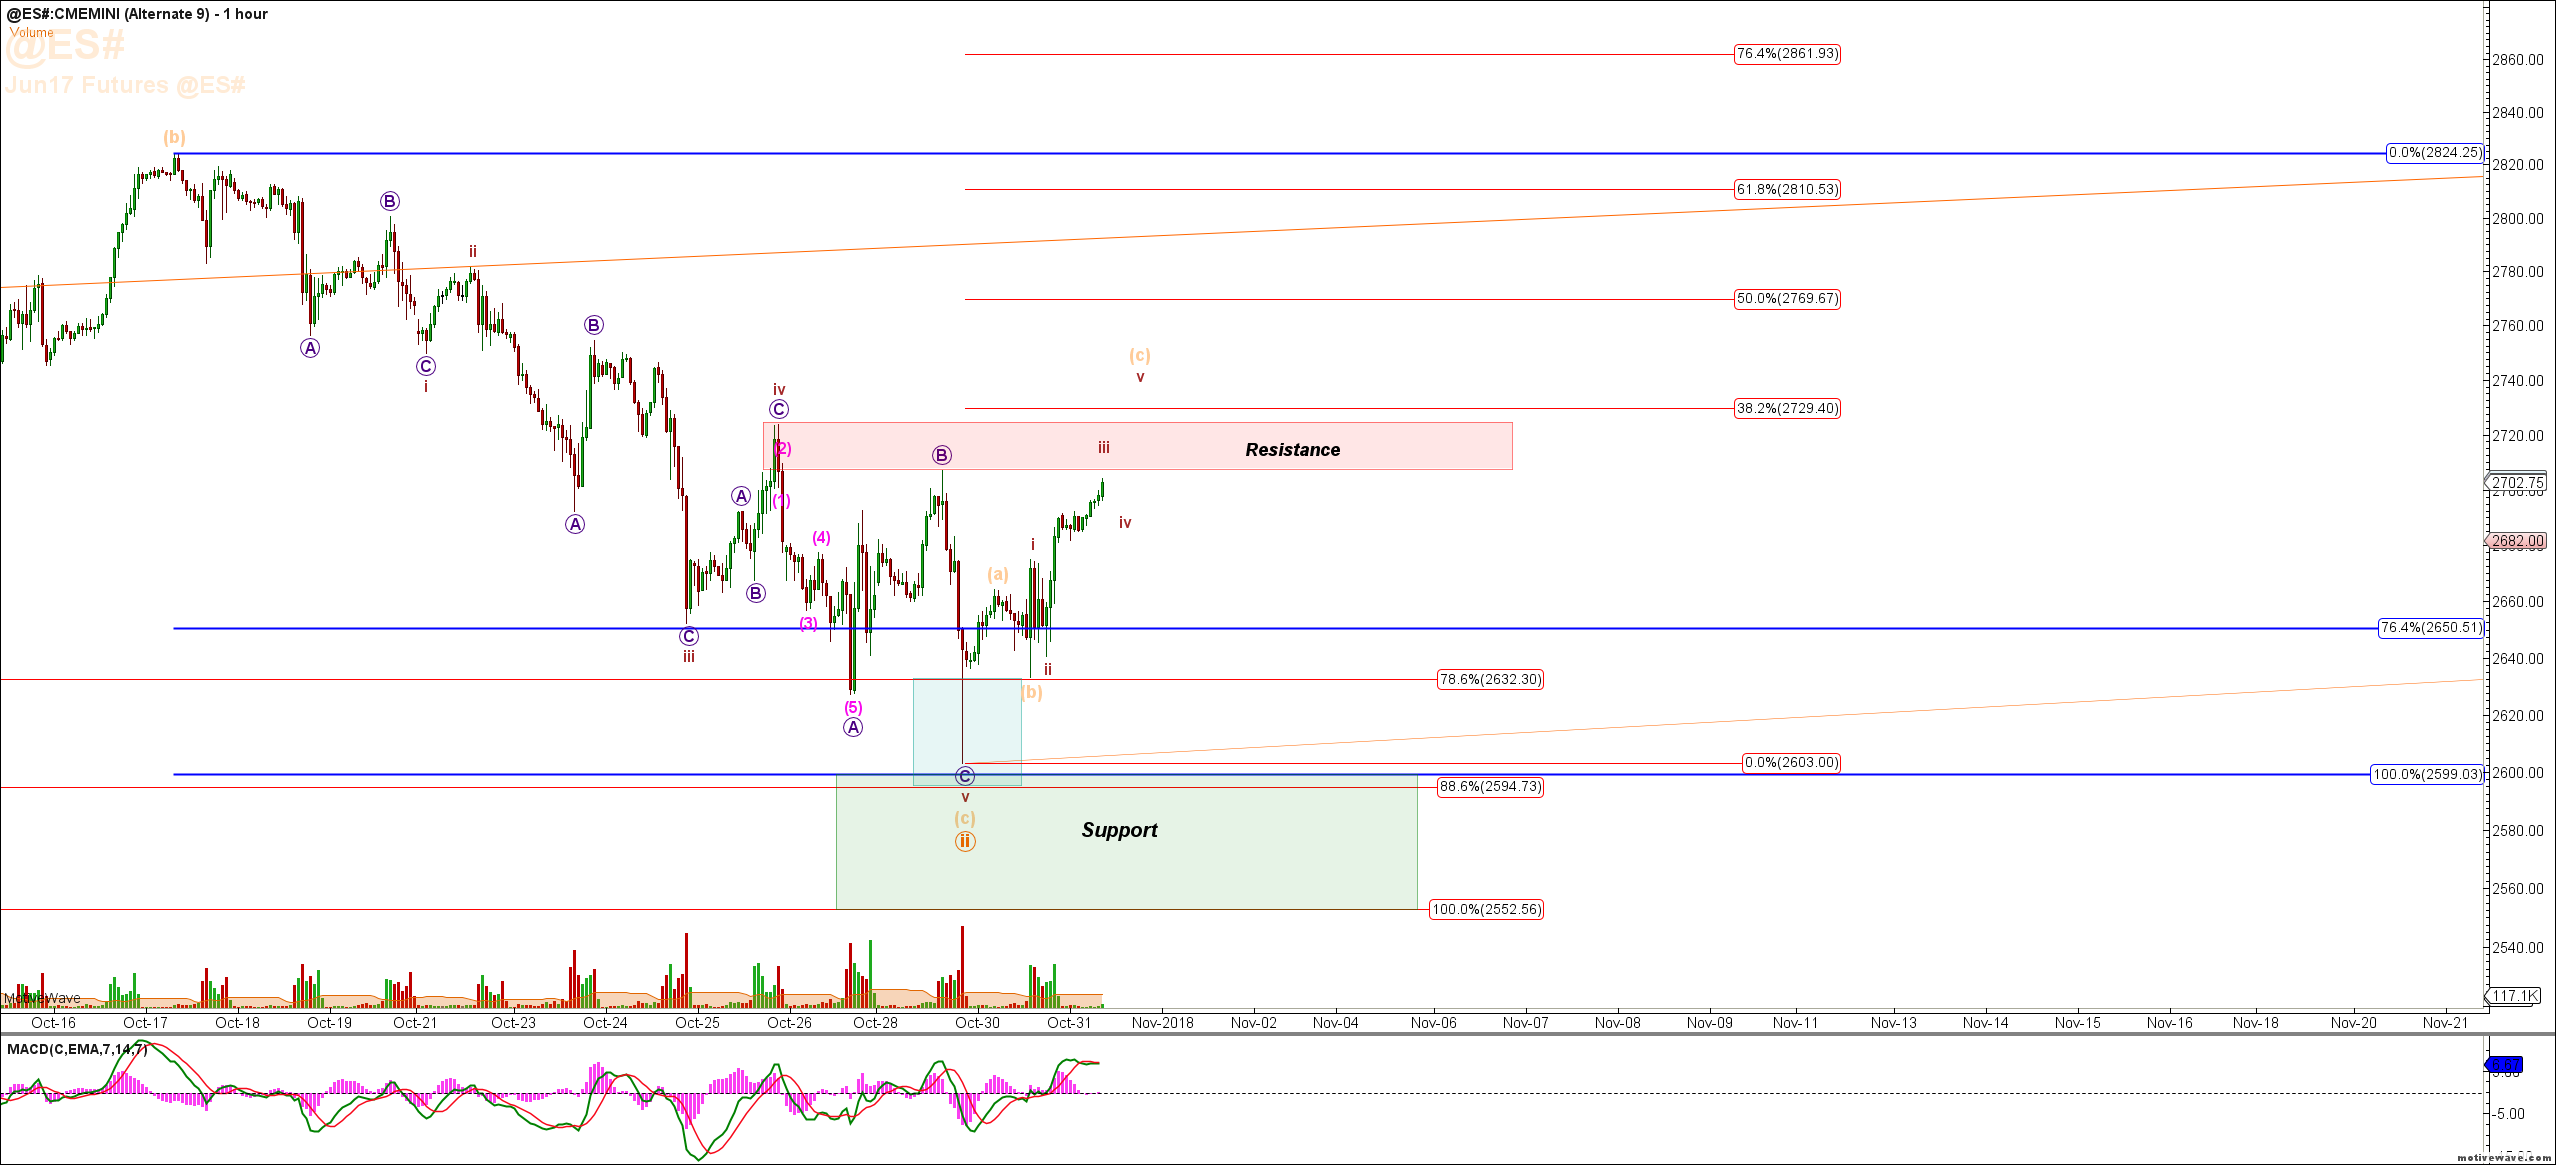
On Monday the ES came up to the 1.00 extension in an A B C structure off last weeks low and then reversed down to make an new local low. That low came just shy of hitting the 1.00 extension at ES 2600 for the entire move down off the recent ATH. Since that low we have now seen ES make a strong move to the upside. IF we have now seen the swing low for this move down in the ES the we now need to see it clear the resistance zones shown in the 60 Minute Charts.

Write comment Views: 5021 Comments: 0

Silver Vs. Gold In The Next Move Up - How To Maximize Performance From The Sector

Brian Fletcher on 24/10/2018 2004 days ago

Summary

Gold, silver and miners are setting up for huge upside potential.

Silver will outpace gold in the next move up.

Silver miners should be part of your miners portfolio.

Upside price targets for both silver and gold.

Write comment Views: 4497 Comments: 0

Gold GC Elliott Wave & Fibonacci Charts & Video 23rd Oct 2018

Mike Richards on 23/10/2018 2005 days ago

Gold (GC) Charts & morning Update

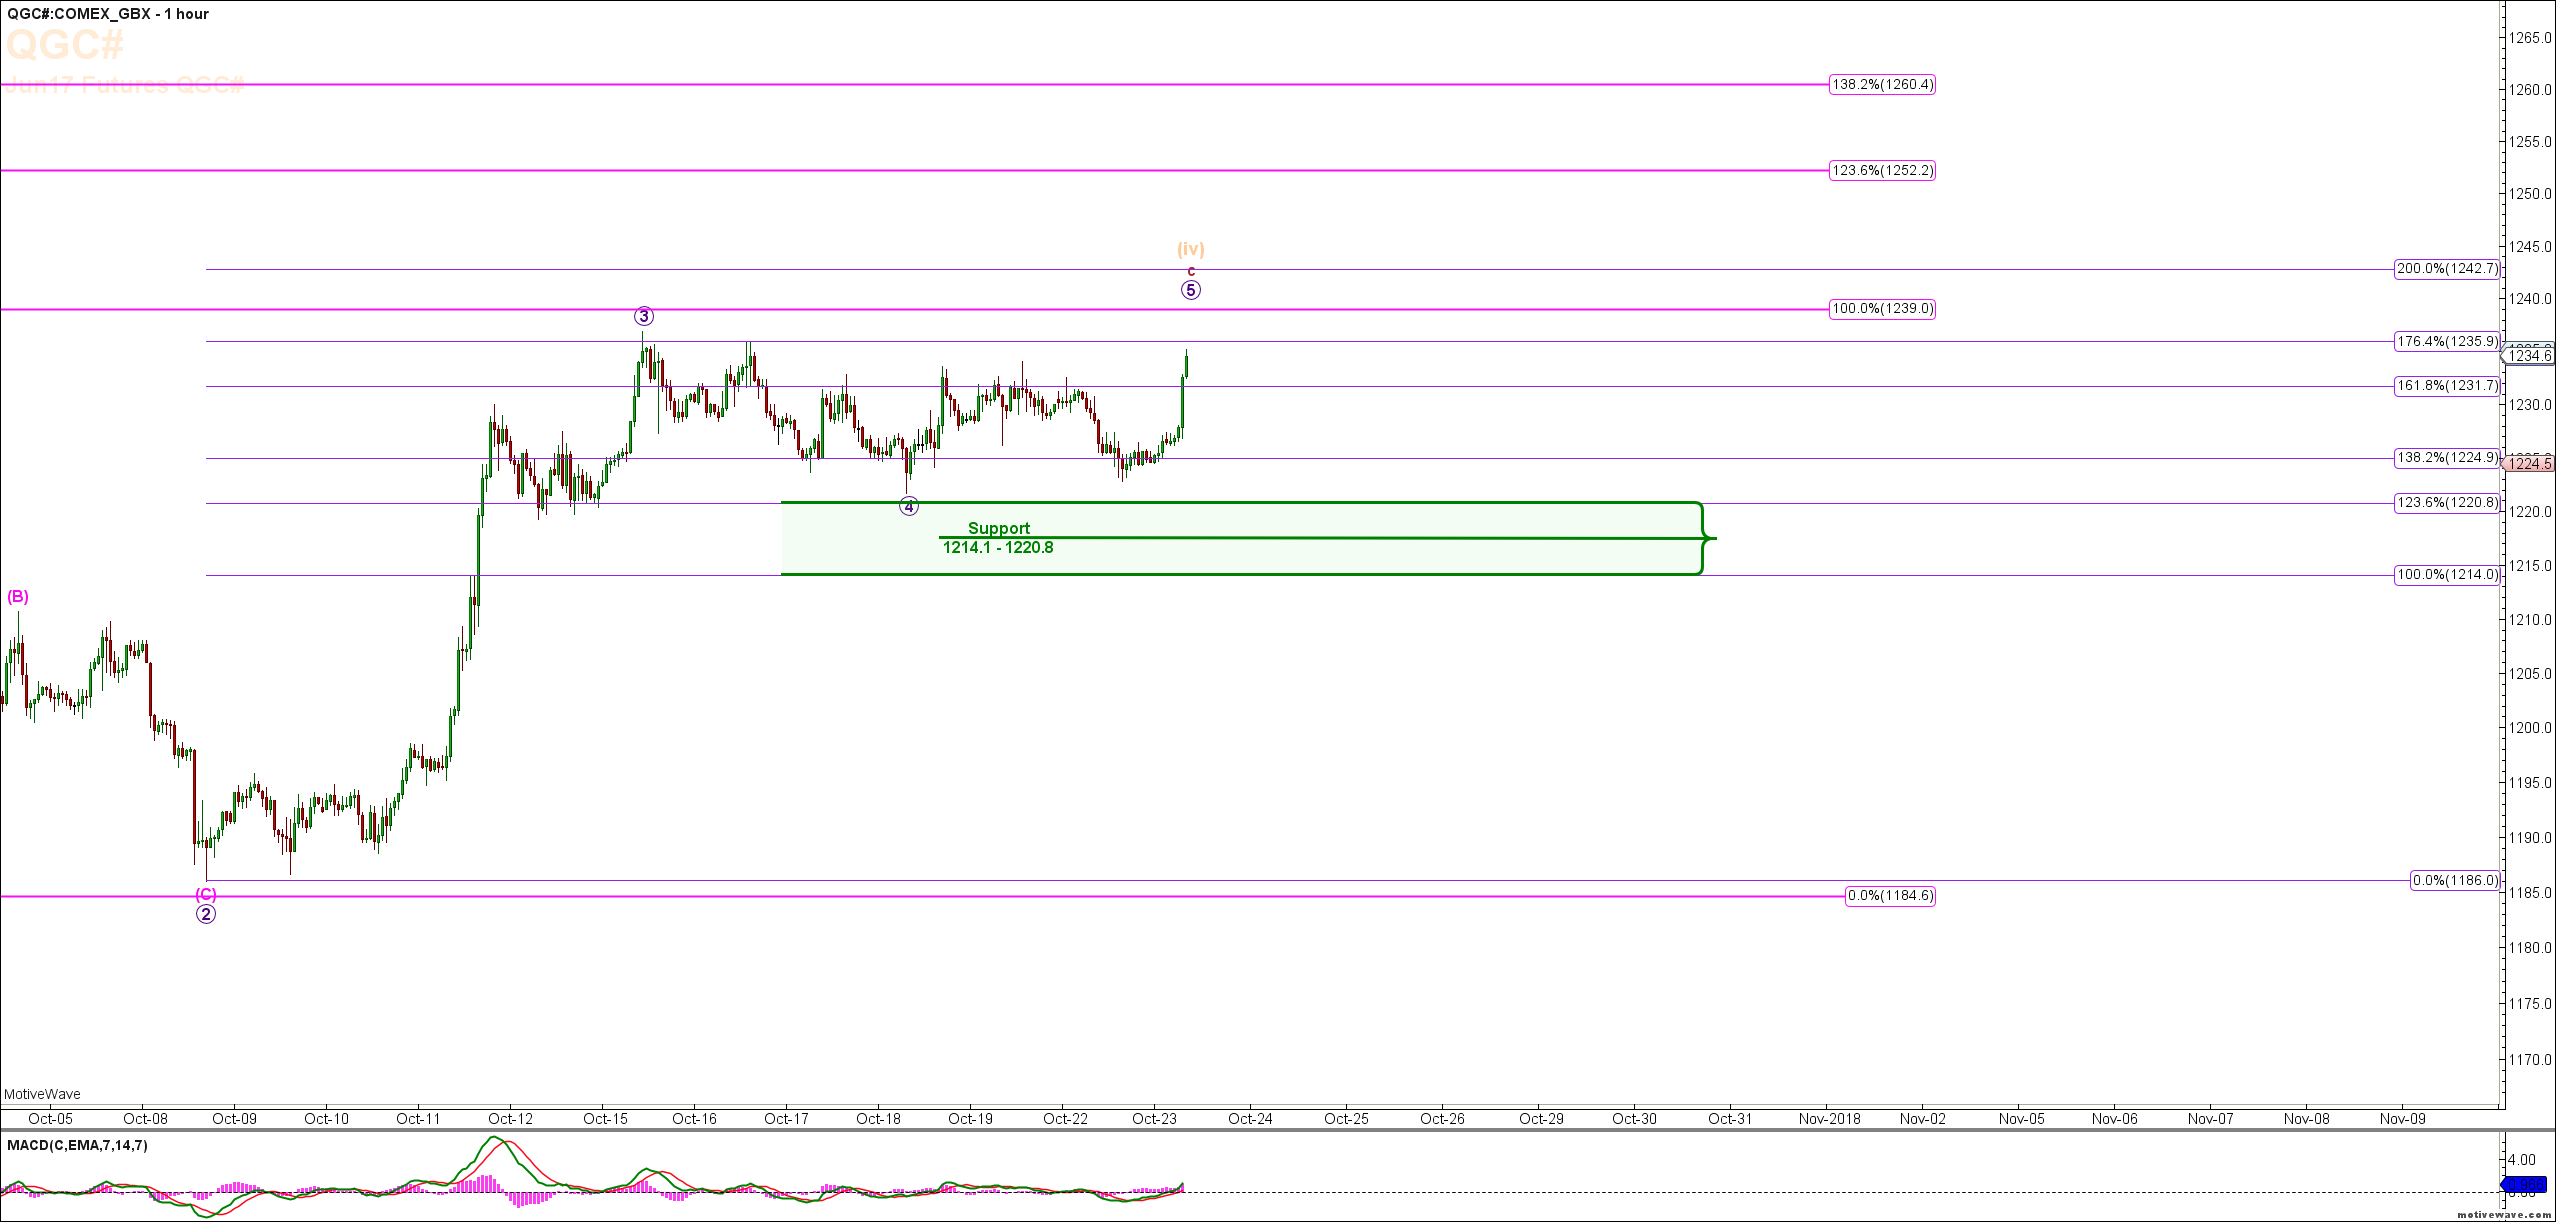
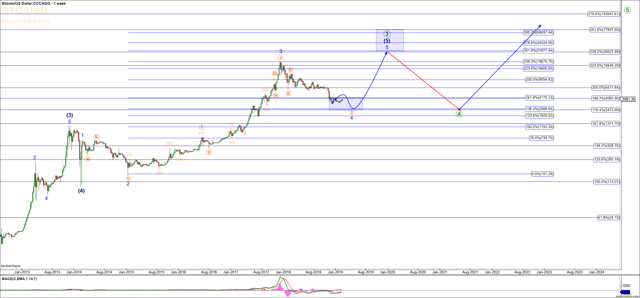
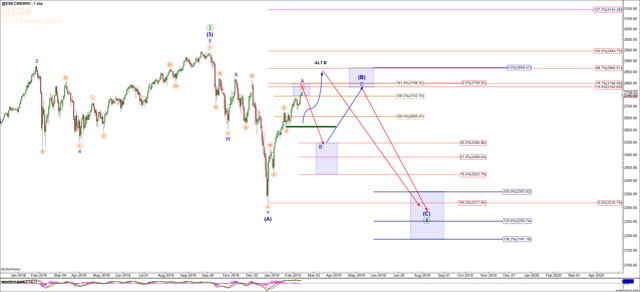
GC pushed strongly higher last week thus confirming that the Minuette Degree Wave (IV) is still in progress and that we are seeing the Sub Minuette Degree Wave c up towards 1238-1242 area.  Once this move up completes we should then see GC turn back down in the Minuette Degree Wave (V) of Minor Degree Wave 2 down to the 1149 target level (See Daily Chart). 
Write comment Views: 4687 Comments: 0

S&P 500 (ES) Charts & Video - Elliott Wave & Fibonacci 22nd Oct 2018

Mike Richards on 22/10/2018 2006 days ago

ES Charts & Morning Update:

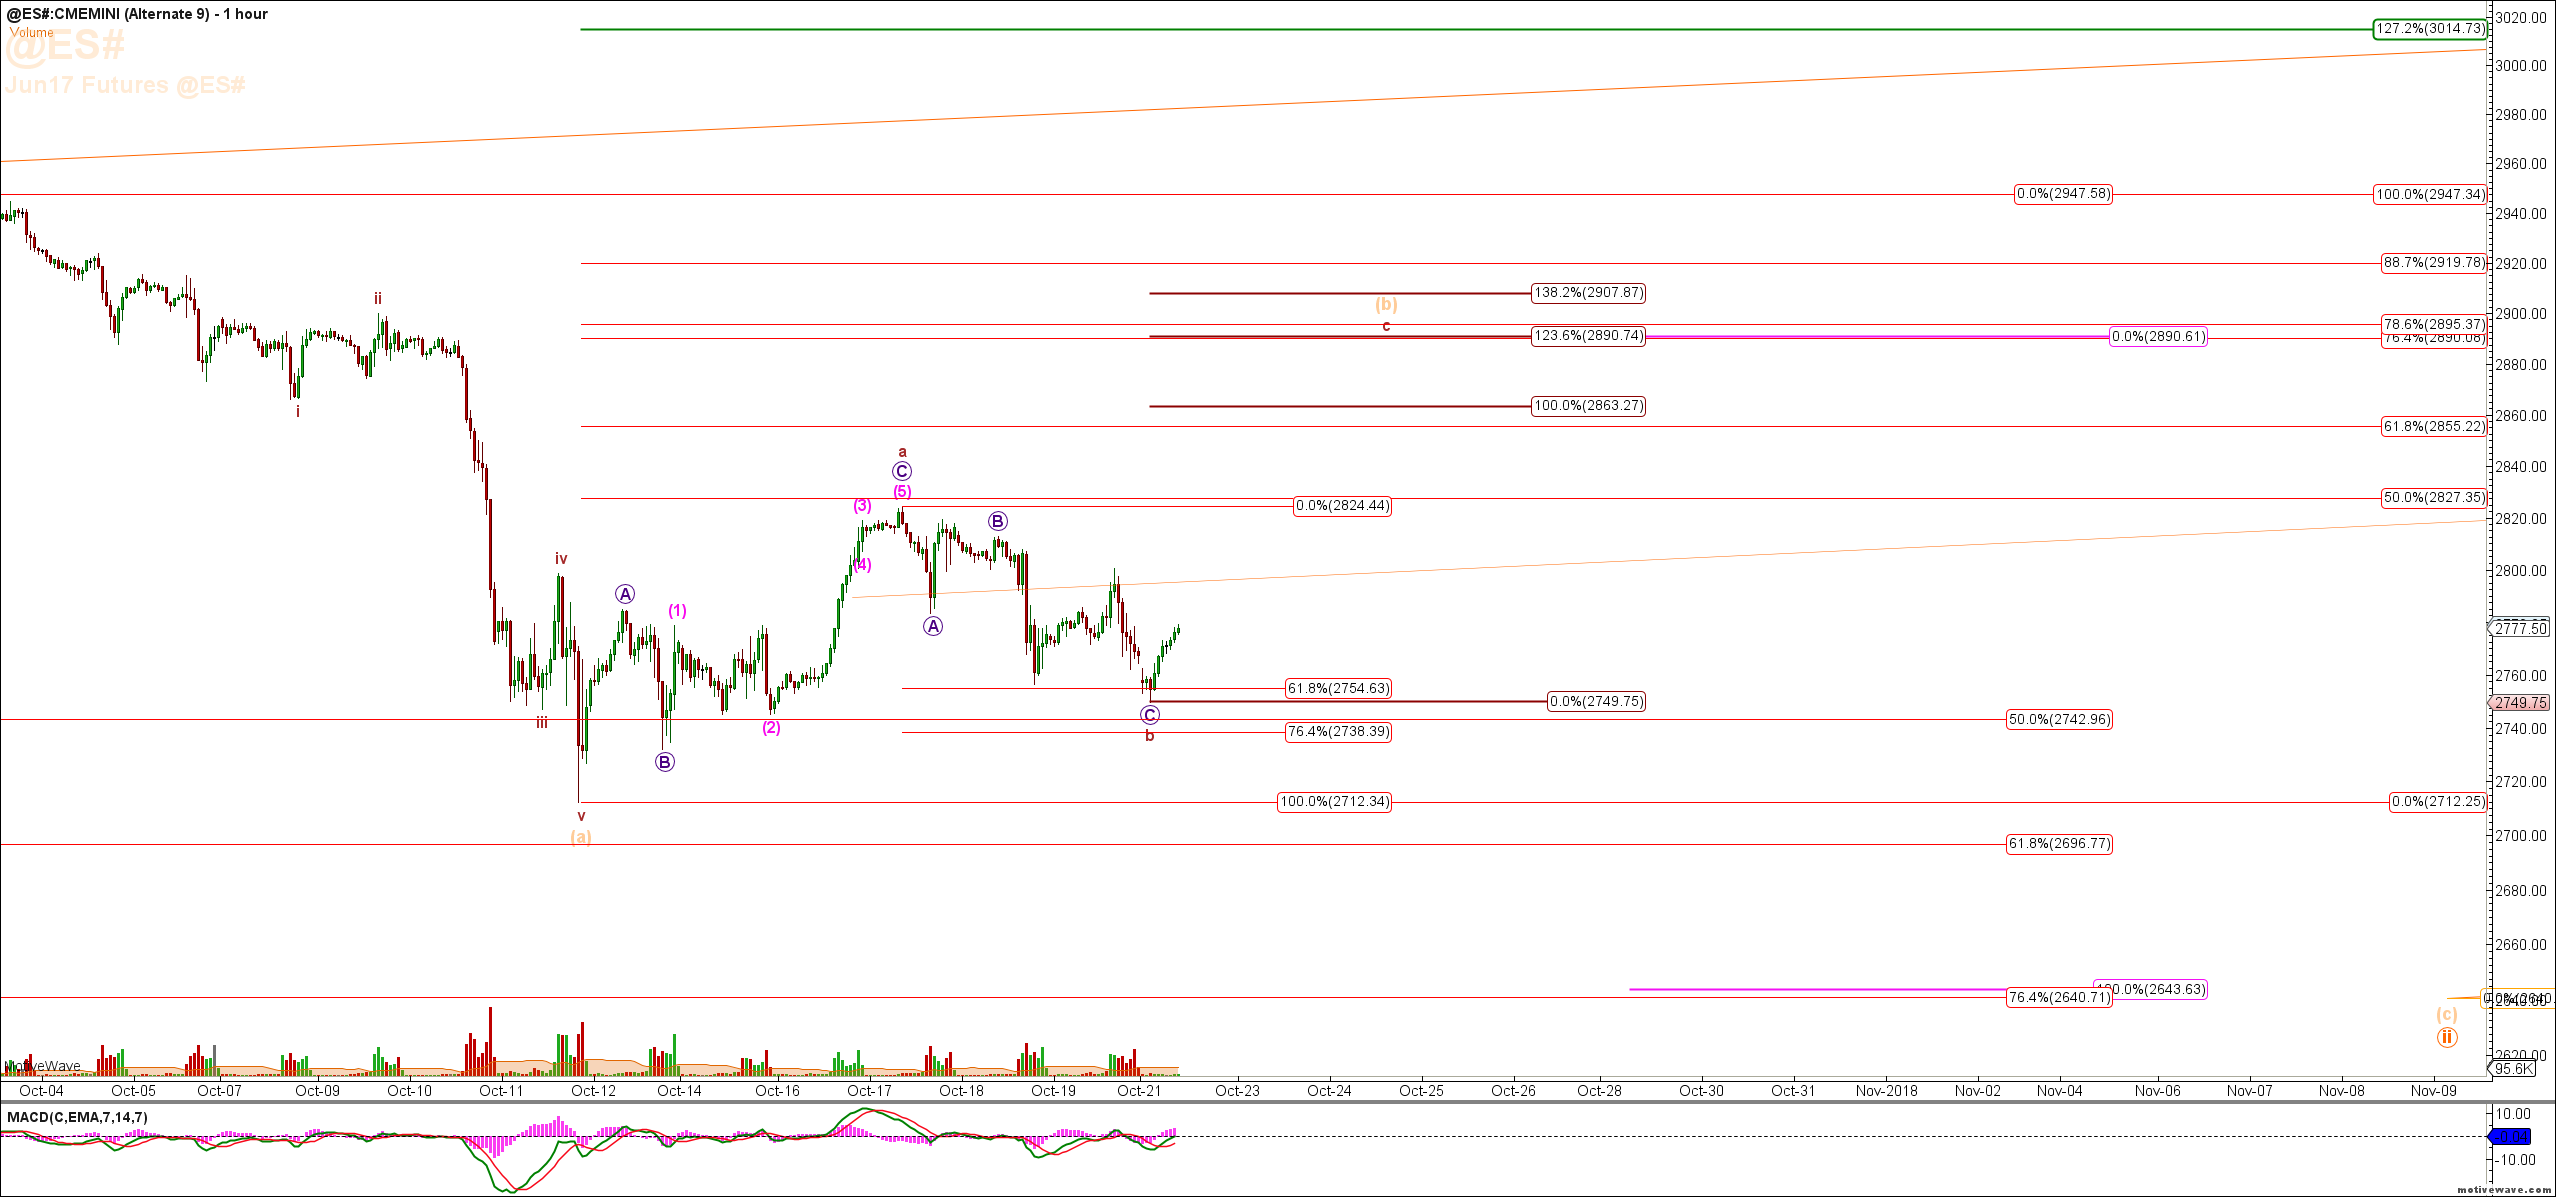
The recent strong move to the downside has removed any possibility of an immediate impulse count higher in the ES and considering the continued downside price action has now made the smaller ending diagonal count where this move lower would count as the C Wave of the IV very unlikely. IF we still have higher levels to come in the ES before we see the start of a much larger correction then the recent low counts as the bottom of an A Wave down of a larger Wave II within an even larger Ending Diagonal Pattern in the ES. 

Write comment Views: 4749 Comments: 0

Bitcoin Charts & Video Update Oct 16th 2018

Mike Richards on 16/10/2018 2012 days ago
Bit Coin put in an all time low back in August 2010 at 0.03 relative to the US Dollar. From there we have seen a spectacular rise in both the price and the euphoric sentiment attached to this relatively new instrument and indeed Crypto Currencies in general. The sentiment crescendo d into late last year when Bit Coin reached an all time high of 19918 before commencing a complex multi month correction which has thus far seen this Major Crypto Currency trade as low as 5525. While this has lead to many becoming disillusioned and even calling for the imminent demise of this emerging sector there are as many still expecting further meteoric rises.
Write comment Views: 4850 Comments: 0

Natural Gas NG Charts and Video 9th Oct 2018

Mike Richards on 09/10/2018 2019 days ago

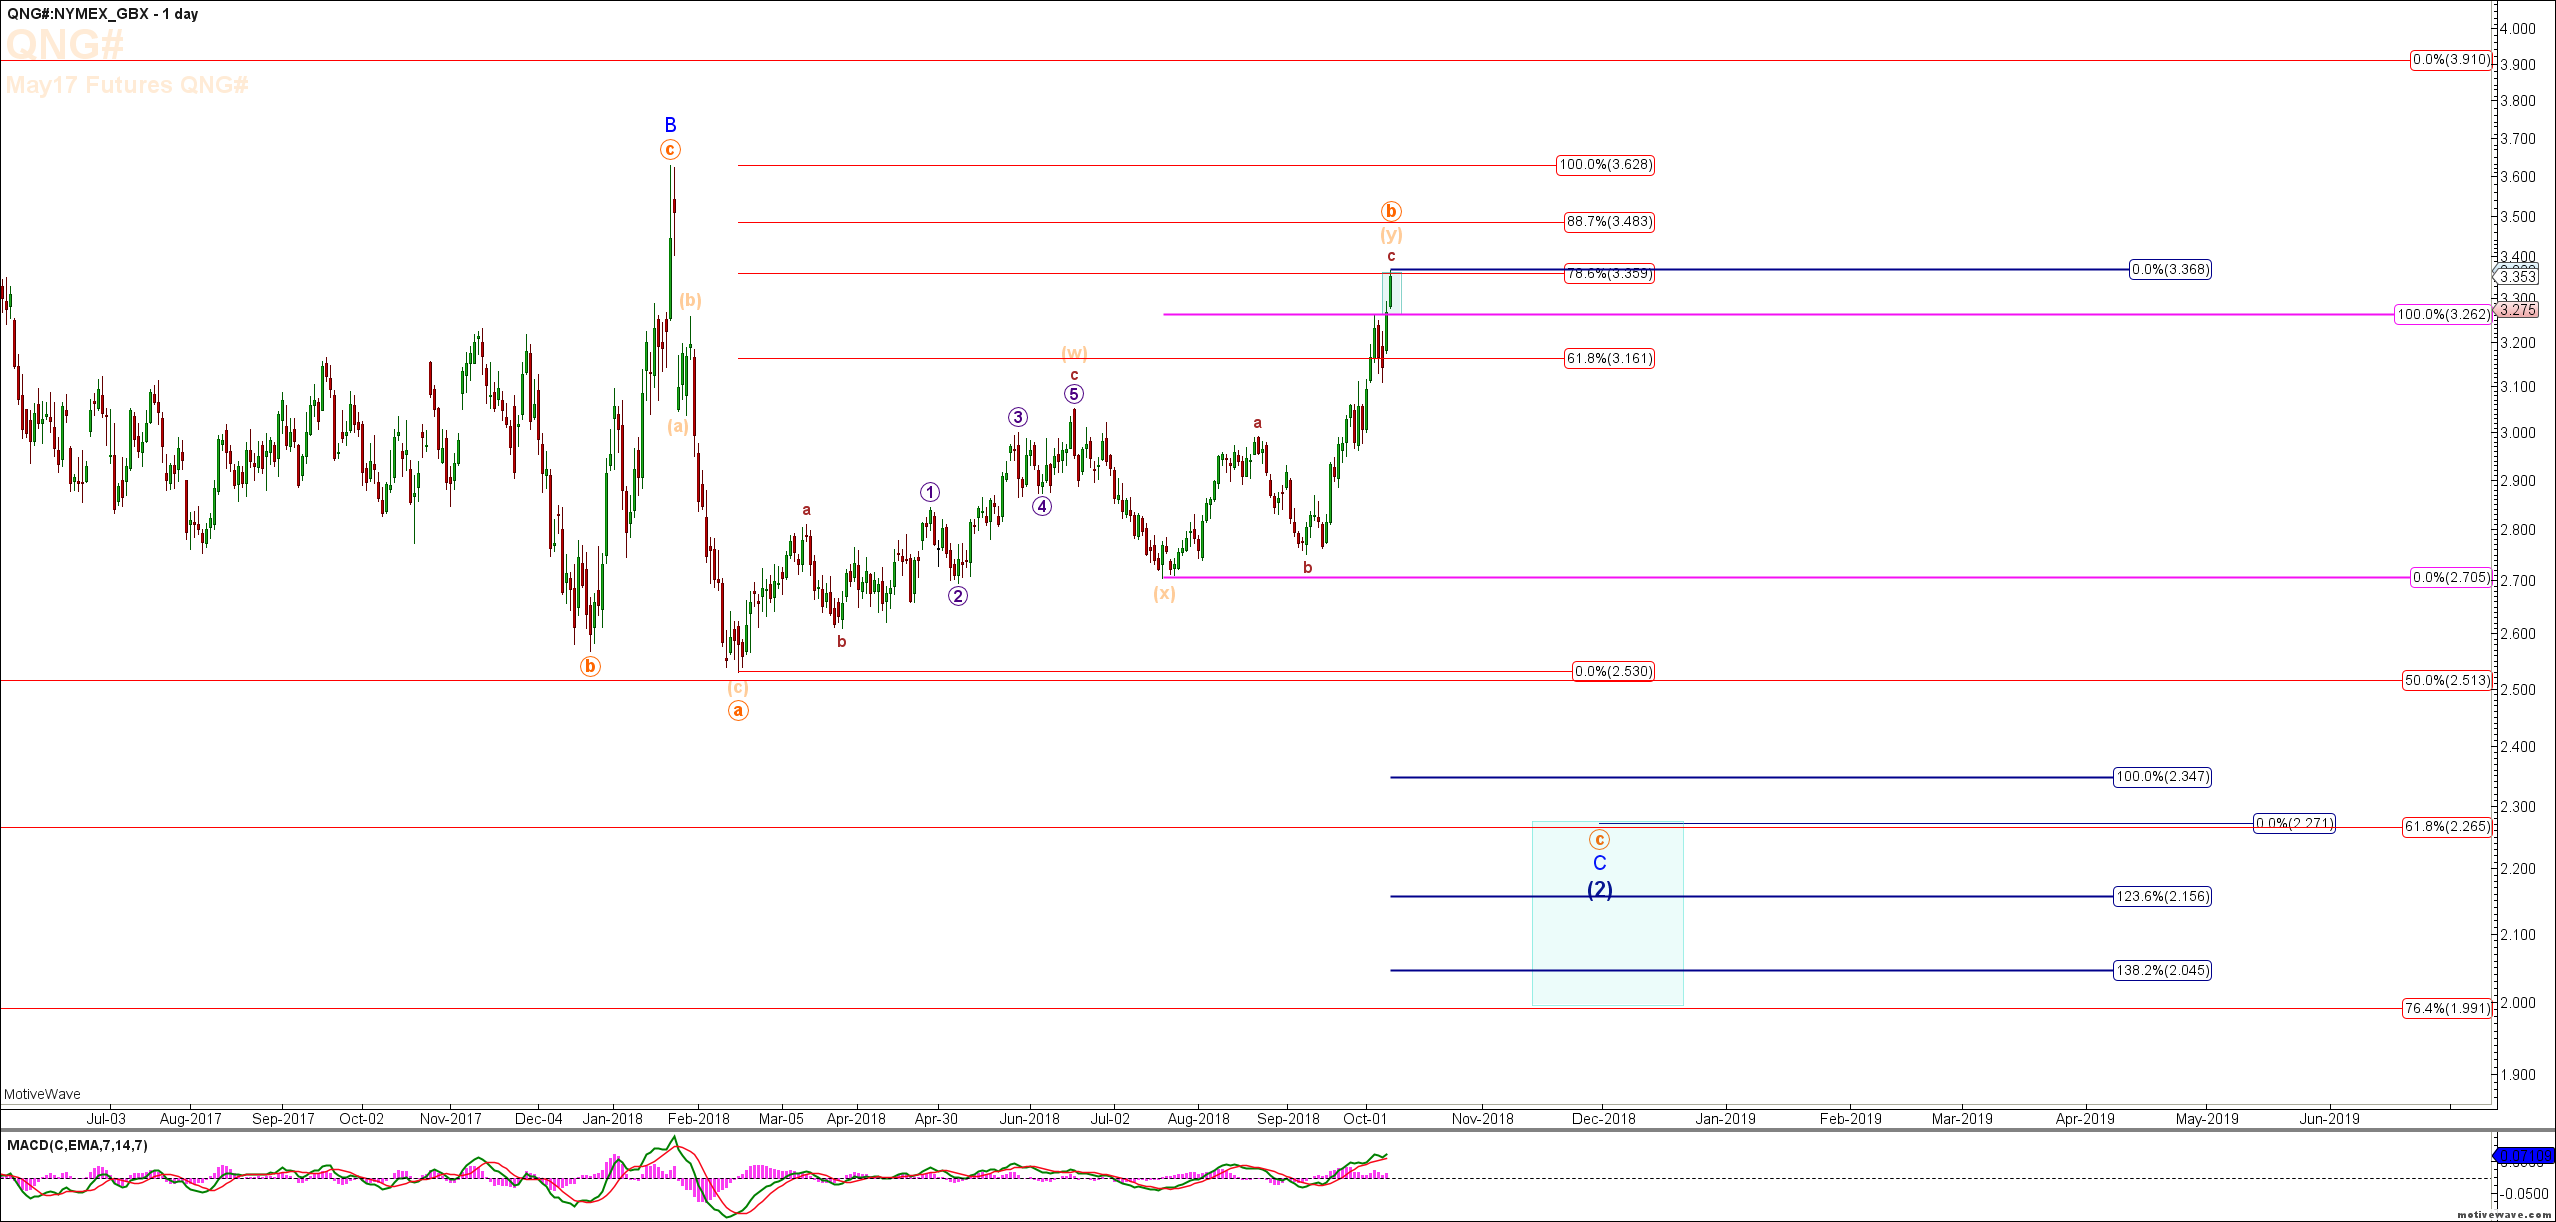
In looking at these extensions up in NG, I think it's trying for a price target of 3.453.  Supportive of this is - 1. It's the 3.618 extension for the (c) wave, a common fib for NG, as shown on the 60 minute chart; 2.  It's slightly over the .786 retrace, which I've noticed that NG does a lot - spikes just over the .786; 3.  It lines up as a spike just over where the (Y) wave is 1.382 x the (W) wave; and 4.  The overall 1.382 for the larger (Y) wave lines up spot on the overall .886 retrace level.

Write comment Views: 4342 Comments: 0

Gold GC Charts and Video 8th Oct 2018

Mike Richards on 08/10/2018 2020 days ago

Gold (GC) Charts & morning Update

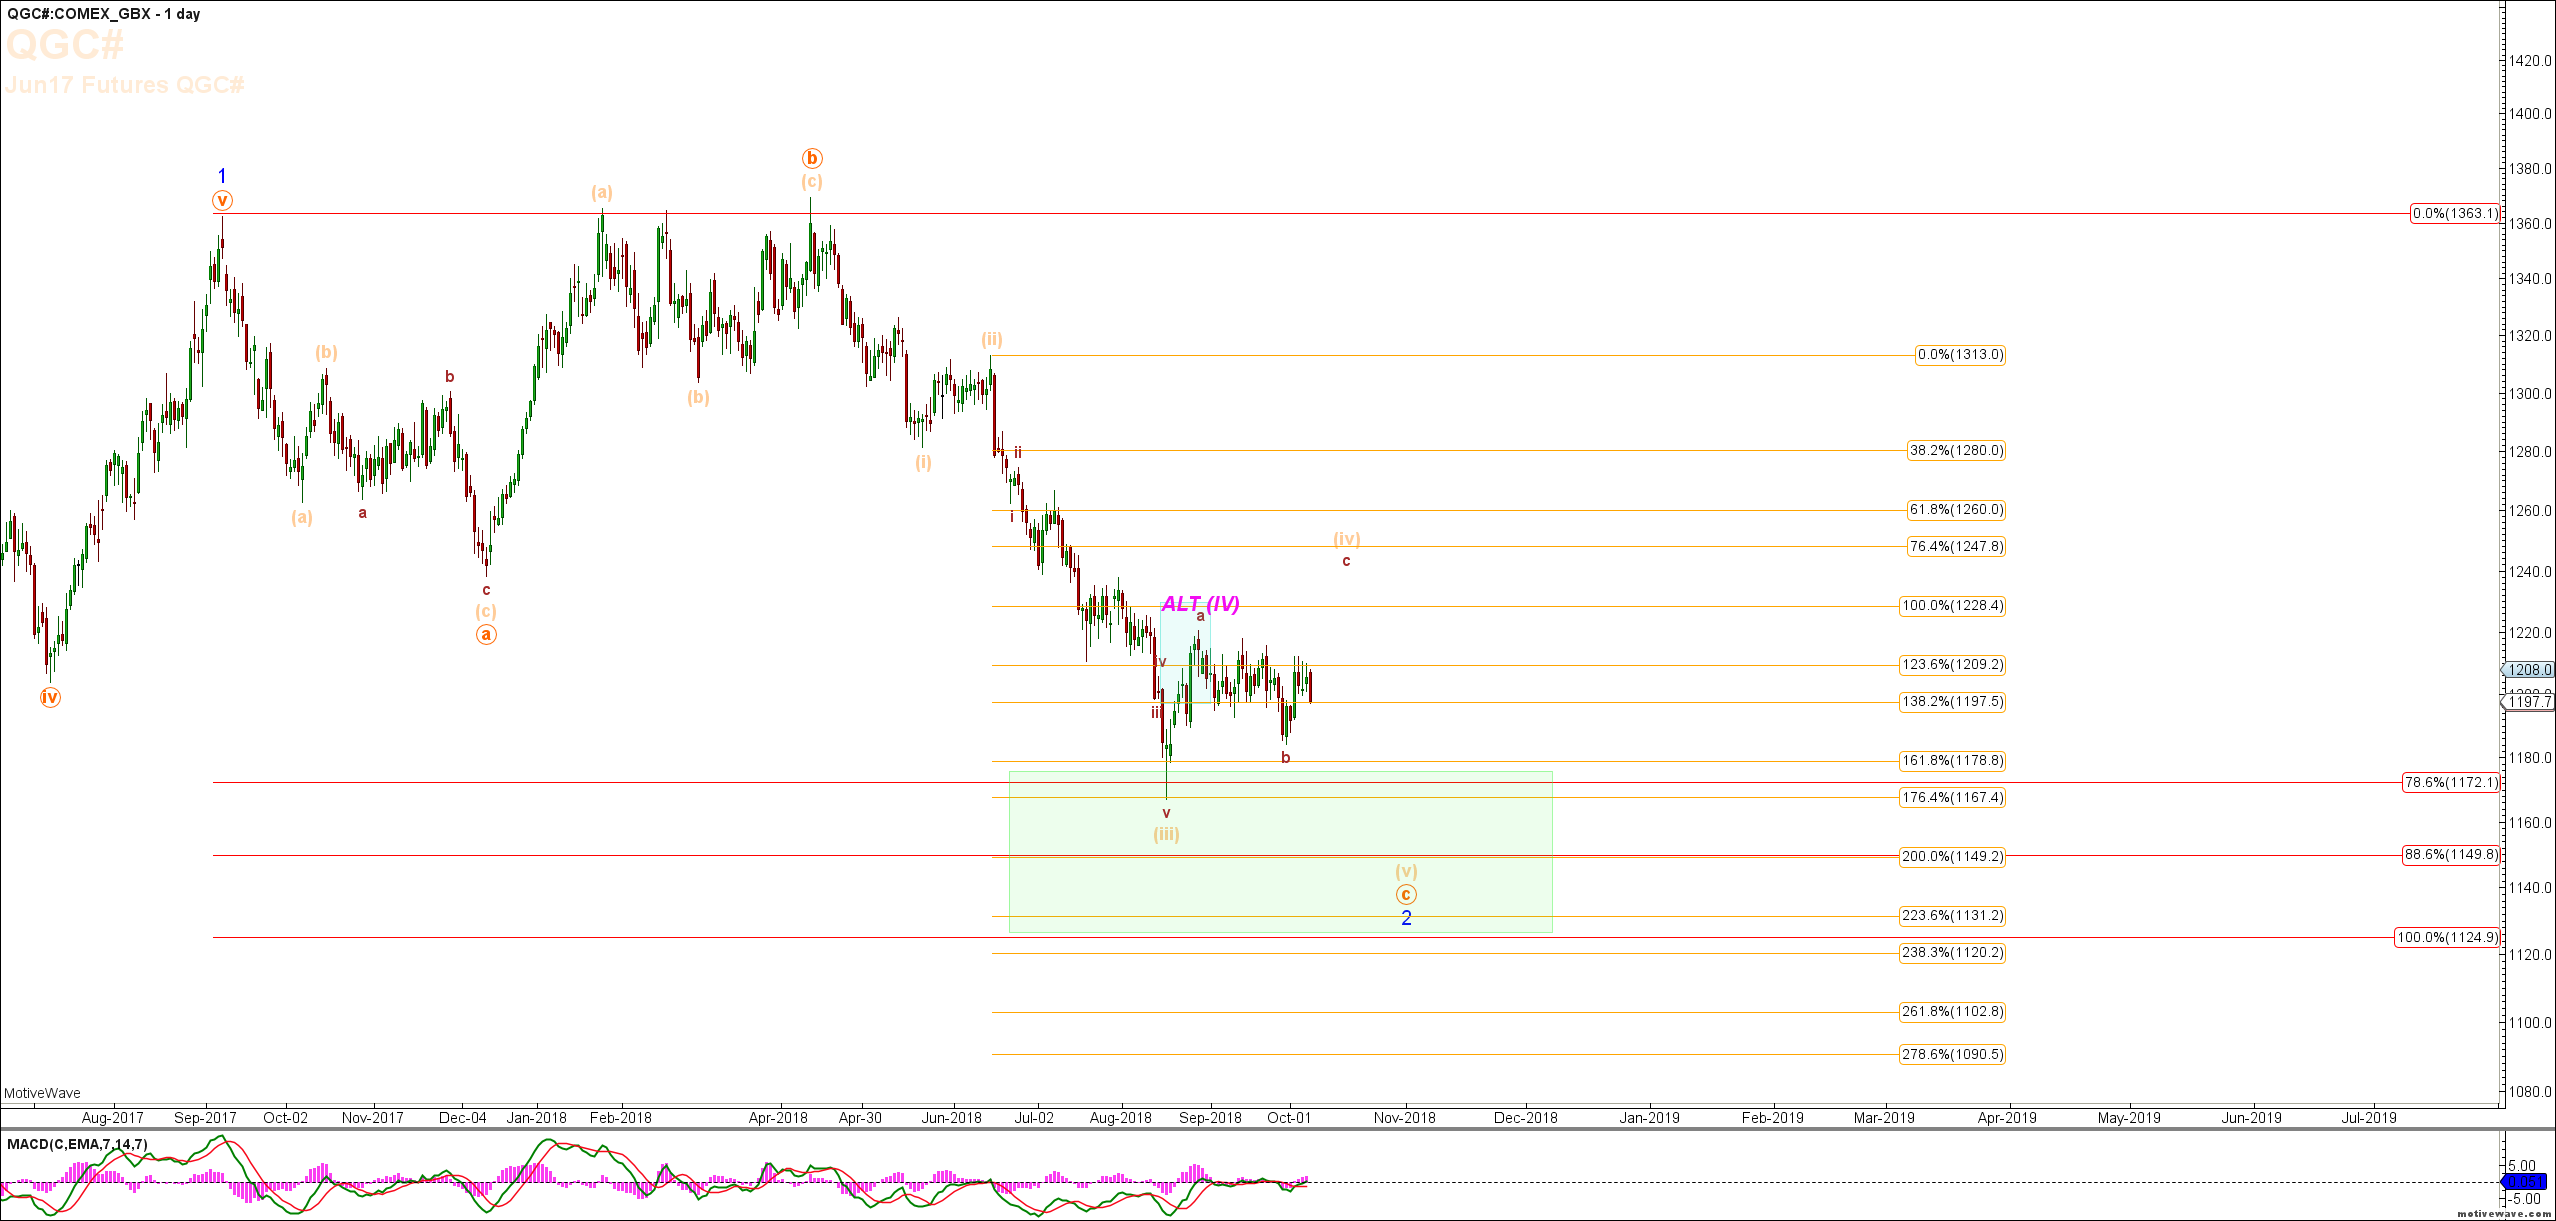
If GC can remain below the recent high at 1215.8 and continue lower then we are in the final Minuette Degree Wave (V) of Minor Degree Wave 2 down to the 1149 target level (See Daily Chart). Above 1221.3 then  we are in the ALT Minuette Degree Wave (IV). I have shown the sub wave structure based on the idea that we are going to see higher levels in GC in the ALT 4 count before resuming lower. 

Write comment Views: 1837 Comments: 0

S&P 500 (ES) Charts & Video

Mike Richards on 05/10/2018 2023 days ago

ES Charts & Morning Update

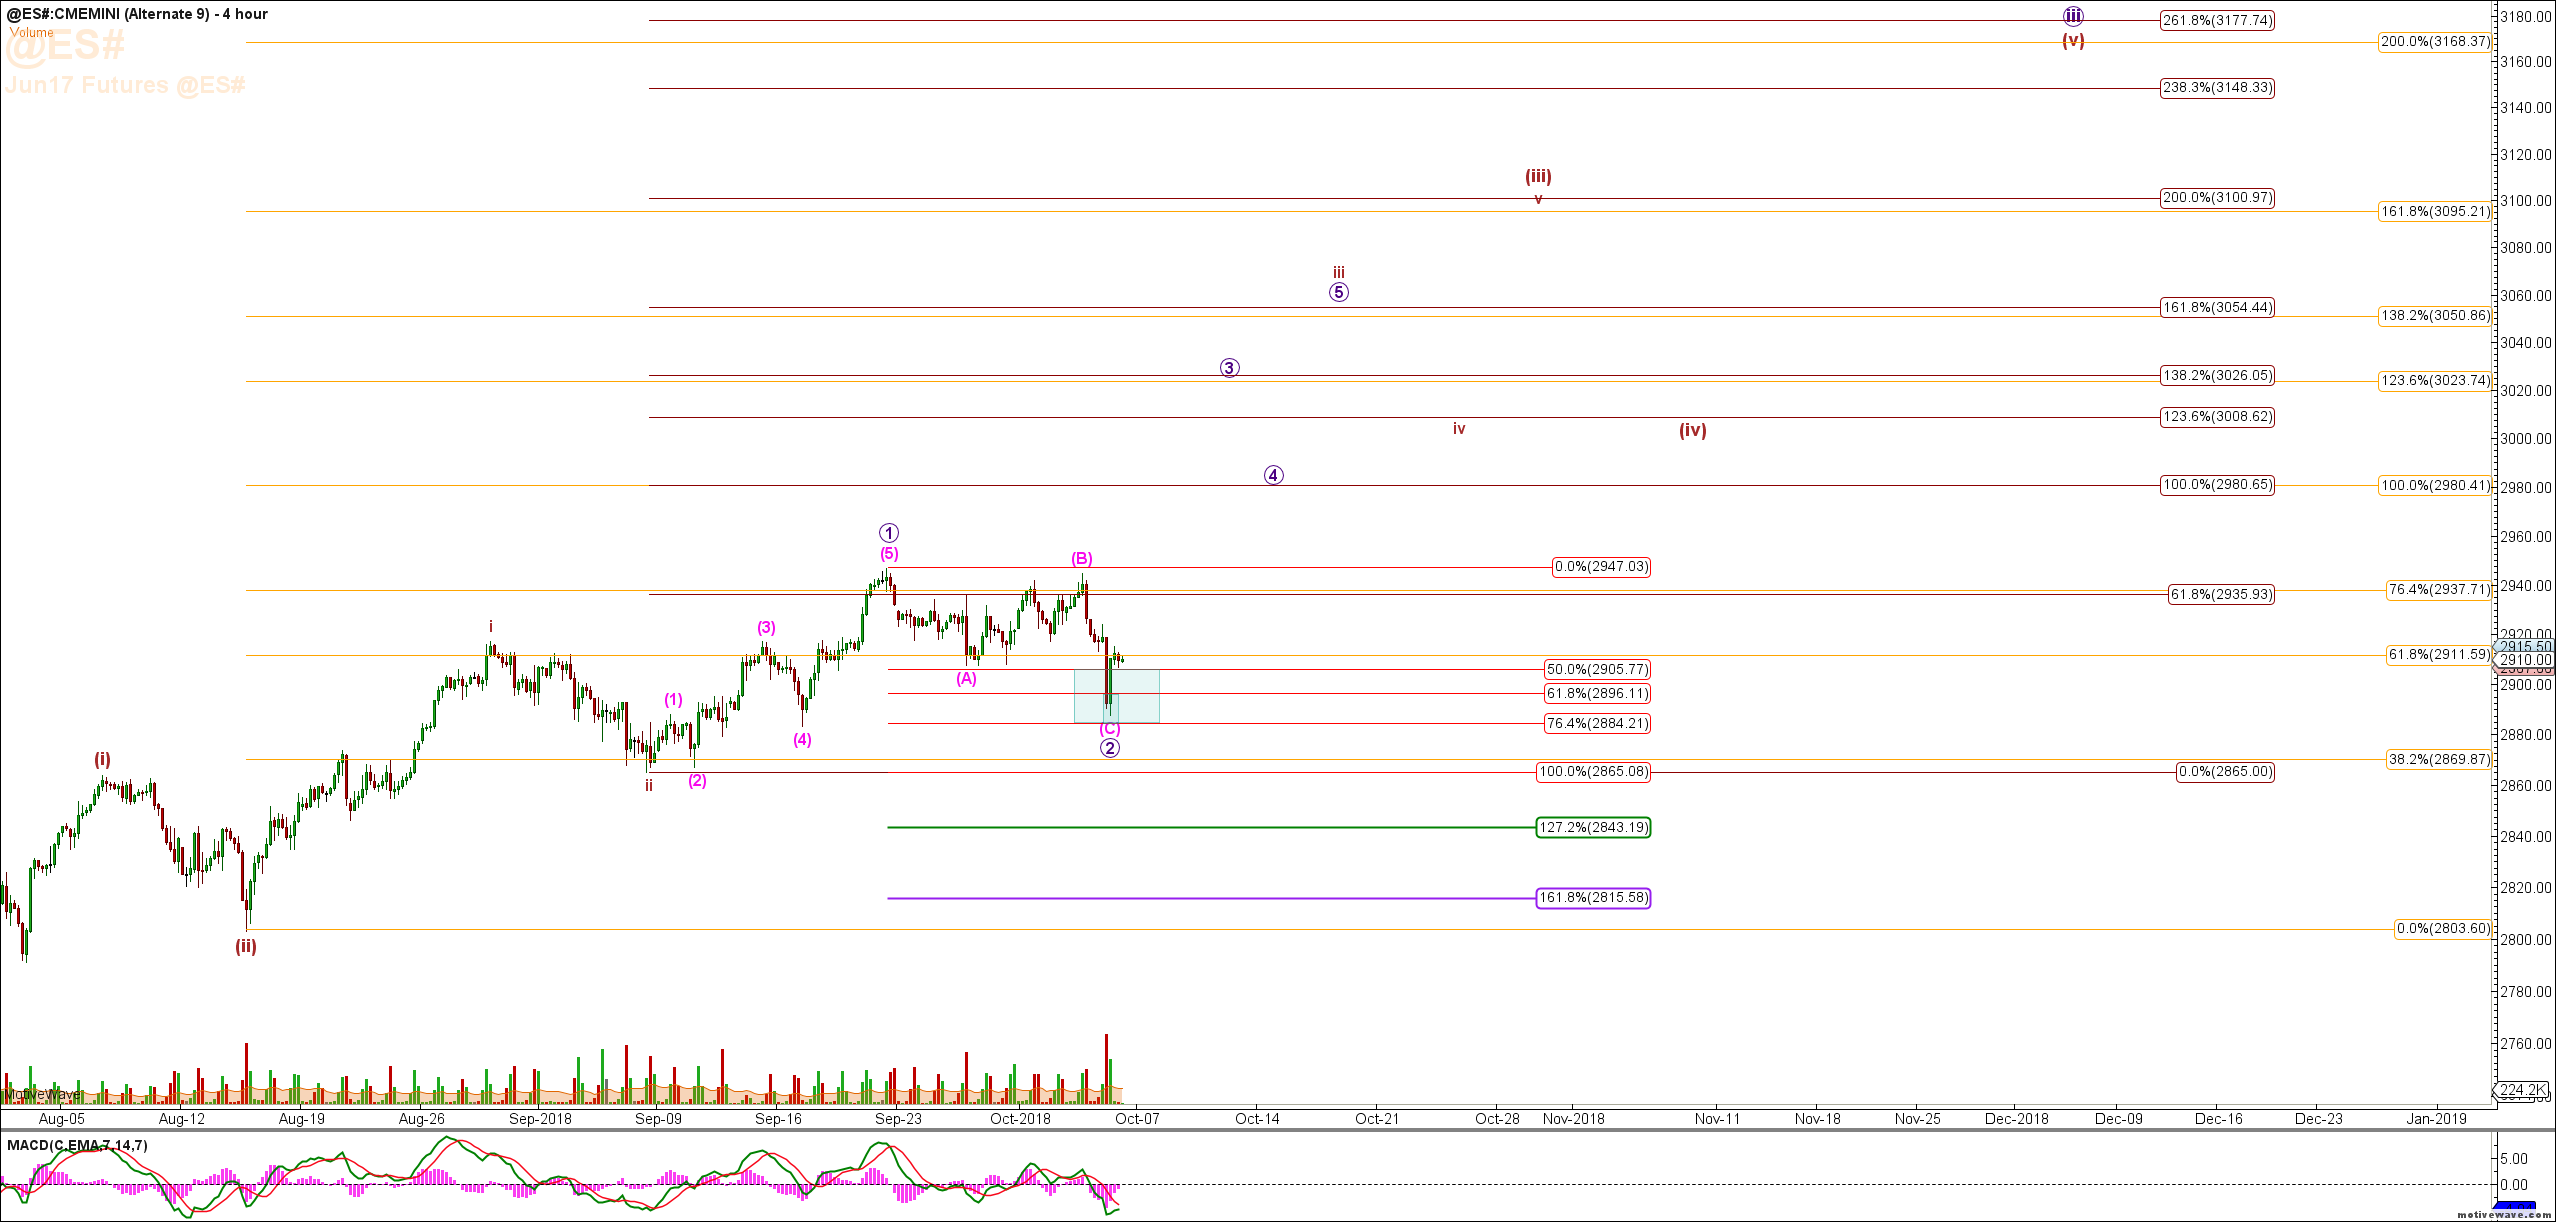
ES futures are trading flat so far this morning. Yesterday we saw the ES drop sharply in the Sub Micro Degree Wave (c) of Micro Degree Wave 2. ES reached just shy of the 76.4% retrace of Micro Degree Wave 1 and then bounced strongly into the close gaining 26 points up off the days low. 

Write comment Views: 2037 Comments: 0

Bit Coin BTC Charts & Video

Mike Richards on 02/10/2018 2026 days ago

Bit Coin Charts & Morning Update:

Bit coin has now completed a full five wave move down off the Sub Minuette Degree b Wave high seen on 4th September. The move down should be the Micro Degree Wave 1 of the Sub Minuette Degree wave C and the subsequent upside reversal is the Micro Degree Wave 2.

Write comment Views: 1741 Comments: 0

S&P 500 Targets - The Grind Up Continues

Brian Fletcher on 28/09/2018 2030 days ago

Summary

Upside targets for the S&P 500.

Don't overstay your welcome.

Alternative investment ideas for when the downside comes.

Write comment Views: 1931 Comments: 0

Natural Gas NG Charts & Video

Mike Richards on 26/09/2018 2032 days ago

NG Charts & Morning Update

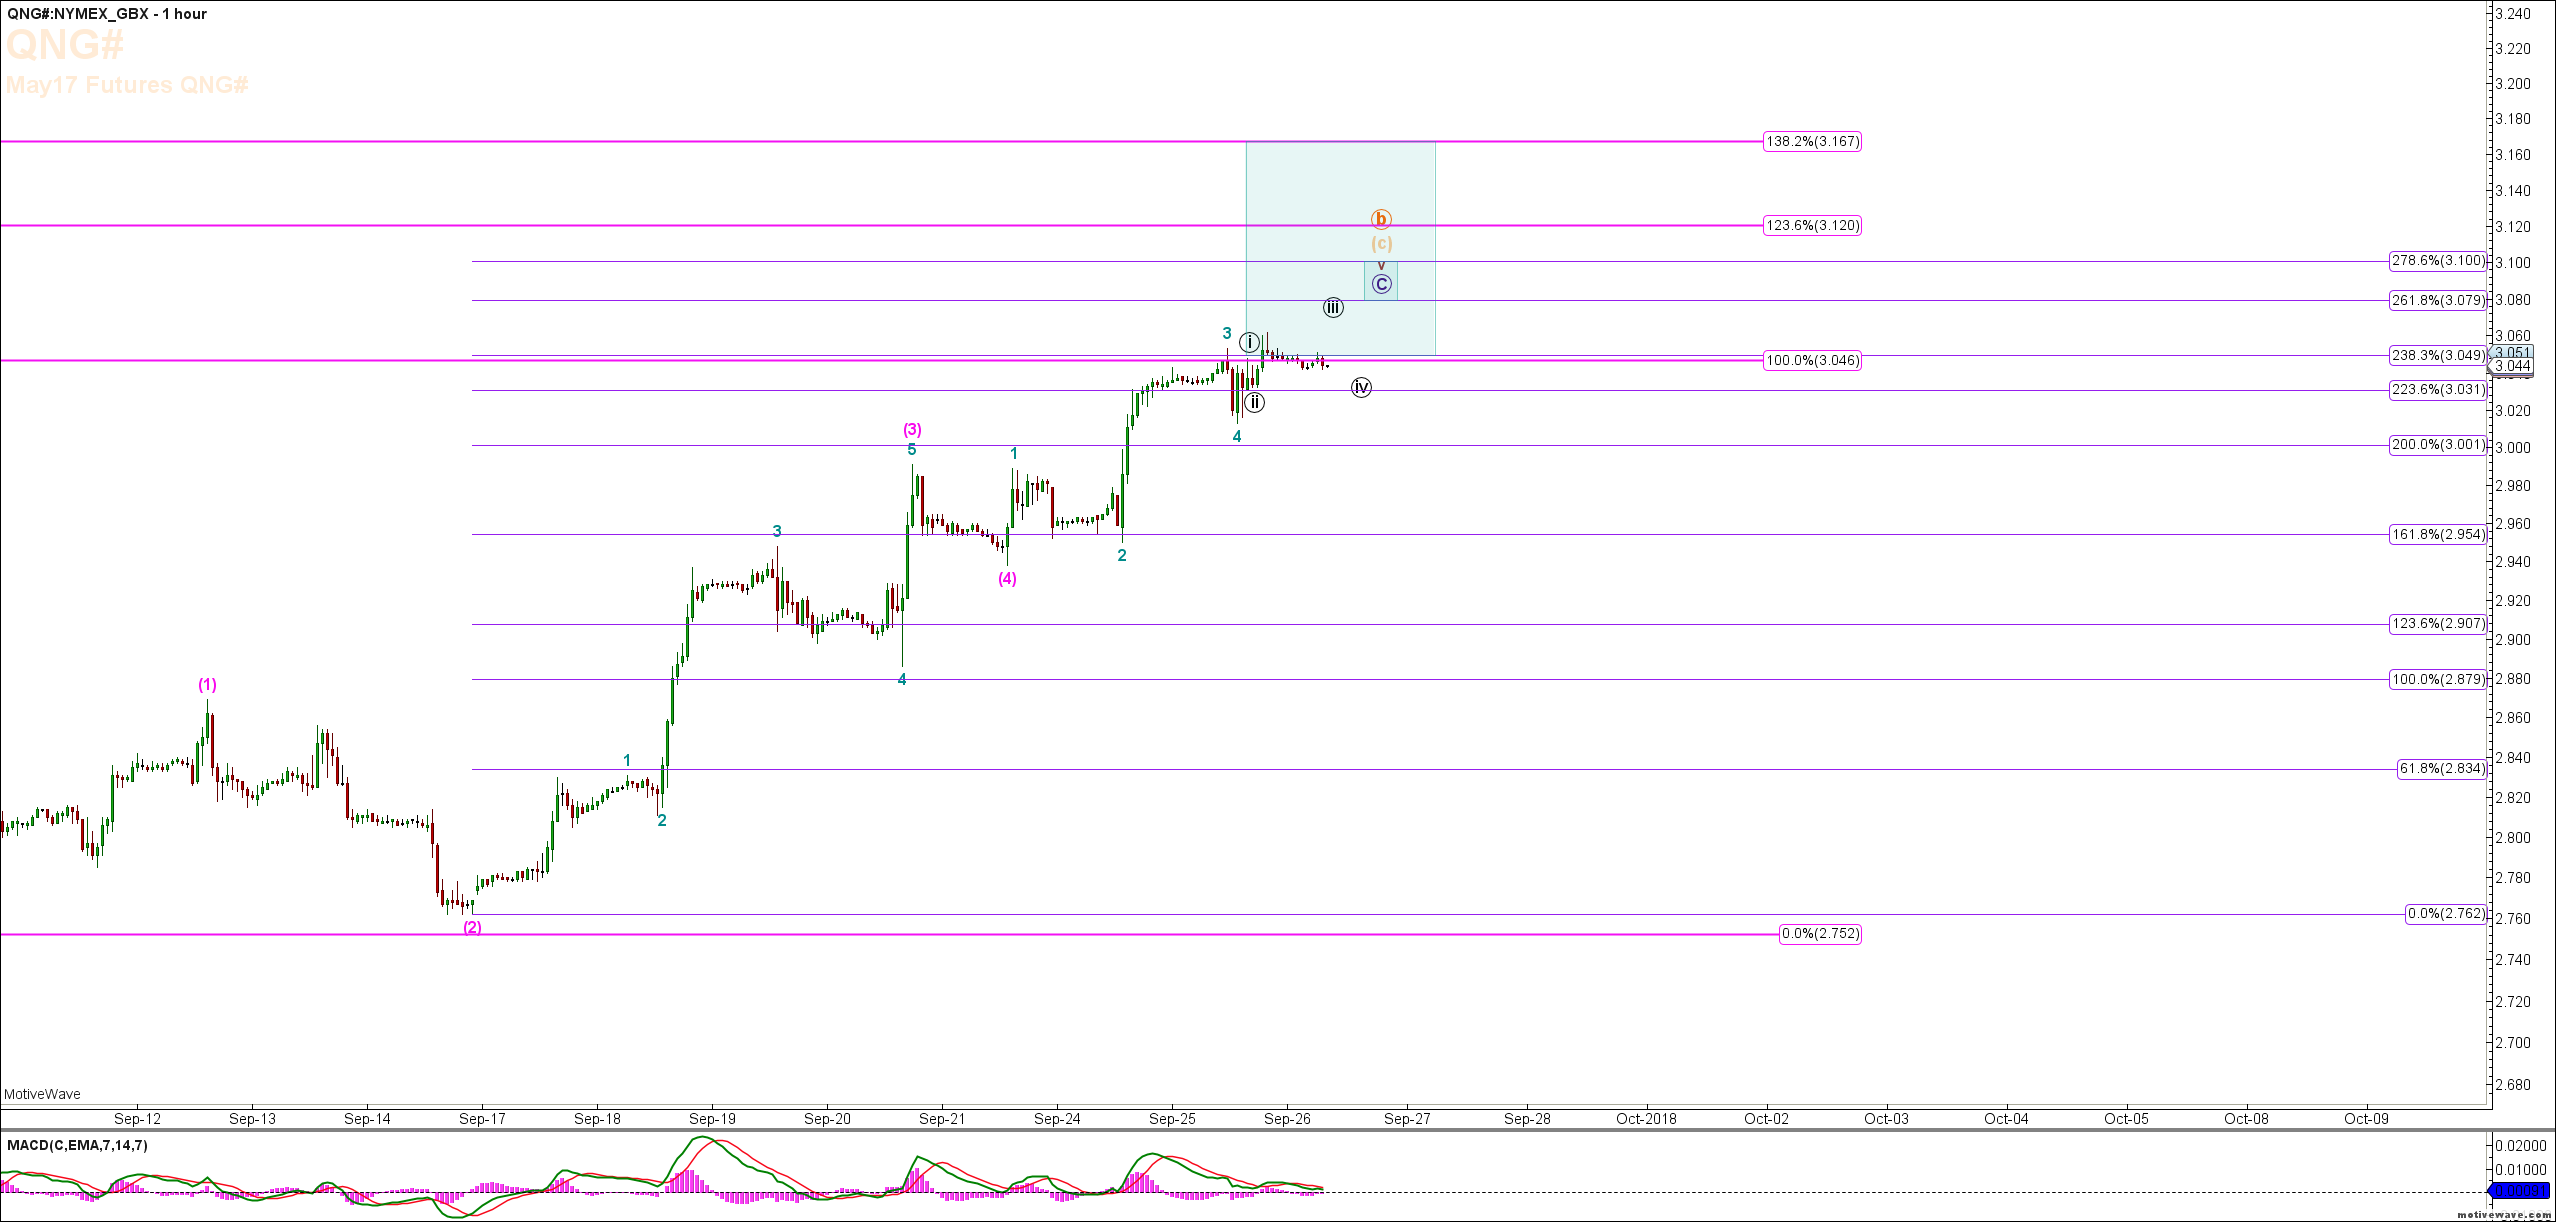
NG has now pushed up and taken out the high seen back in June 2018 thus invalidating the immediate downside count. Looking up a little further now to complete the full 5 wave structure off the low seen on 10th September to complete a higher Minute Degree Wave B before we then start the Minute Degree C

Write comment Views: 1748 Comments: 0

DJIA (YM) - Dow Jones Charts & Video

Mike Richards on 25/09/2018 2033 days ago

DJIA (YM) Charts & Update

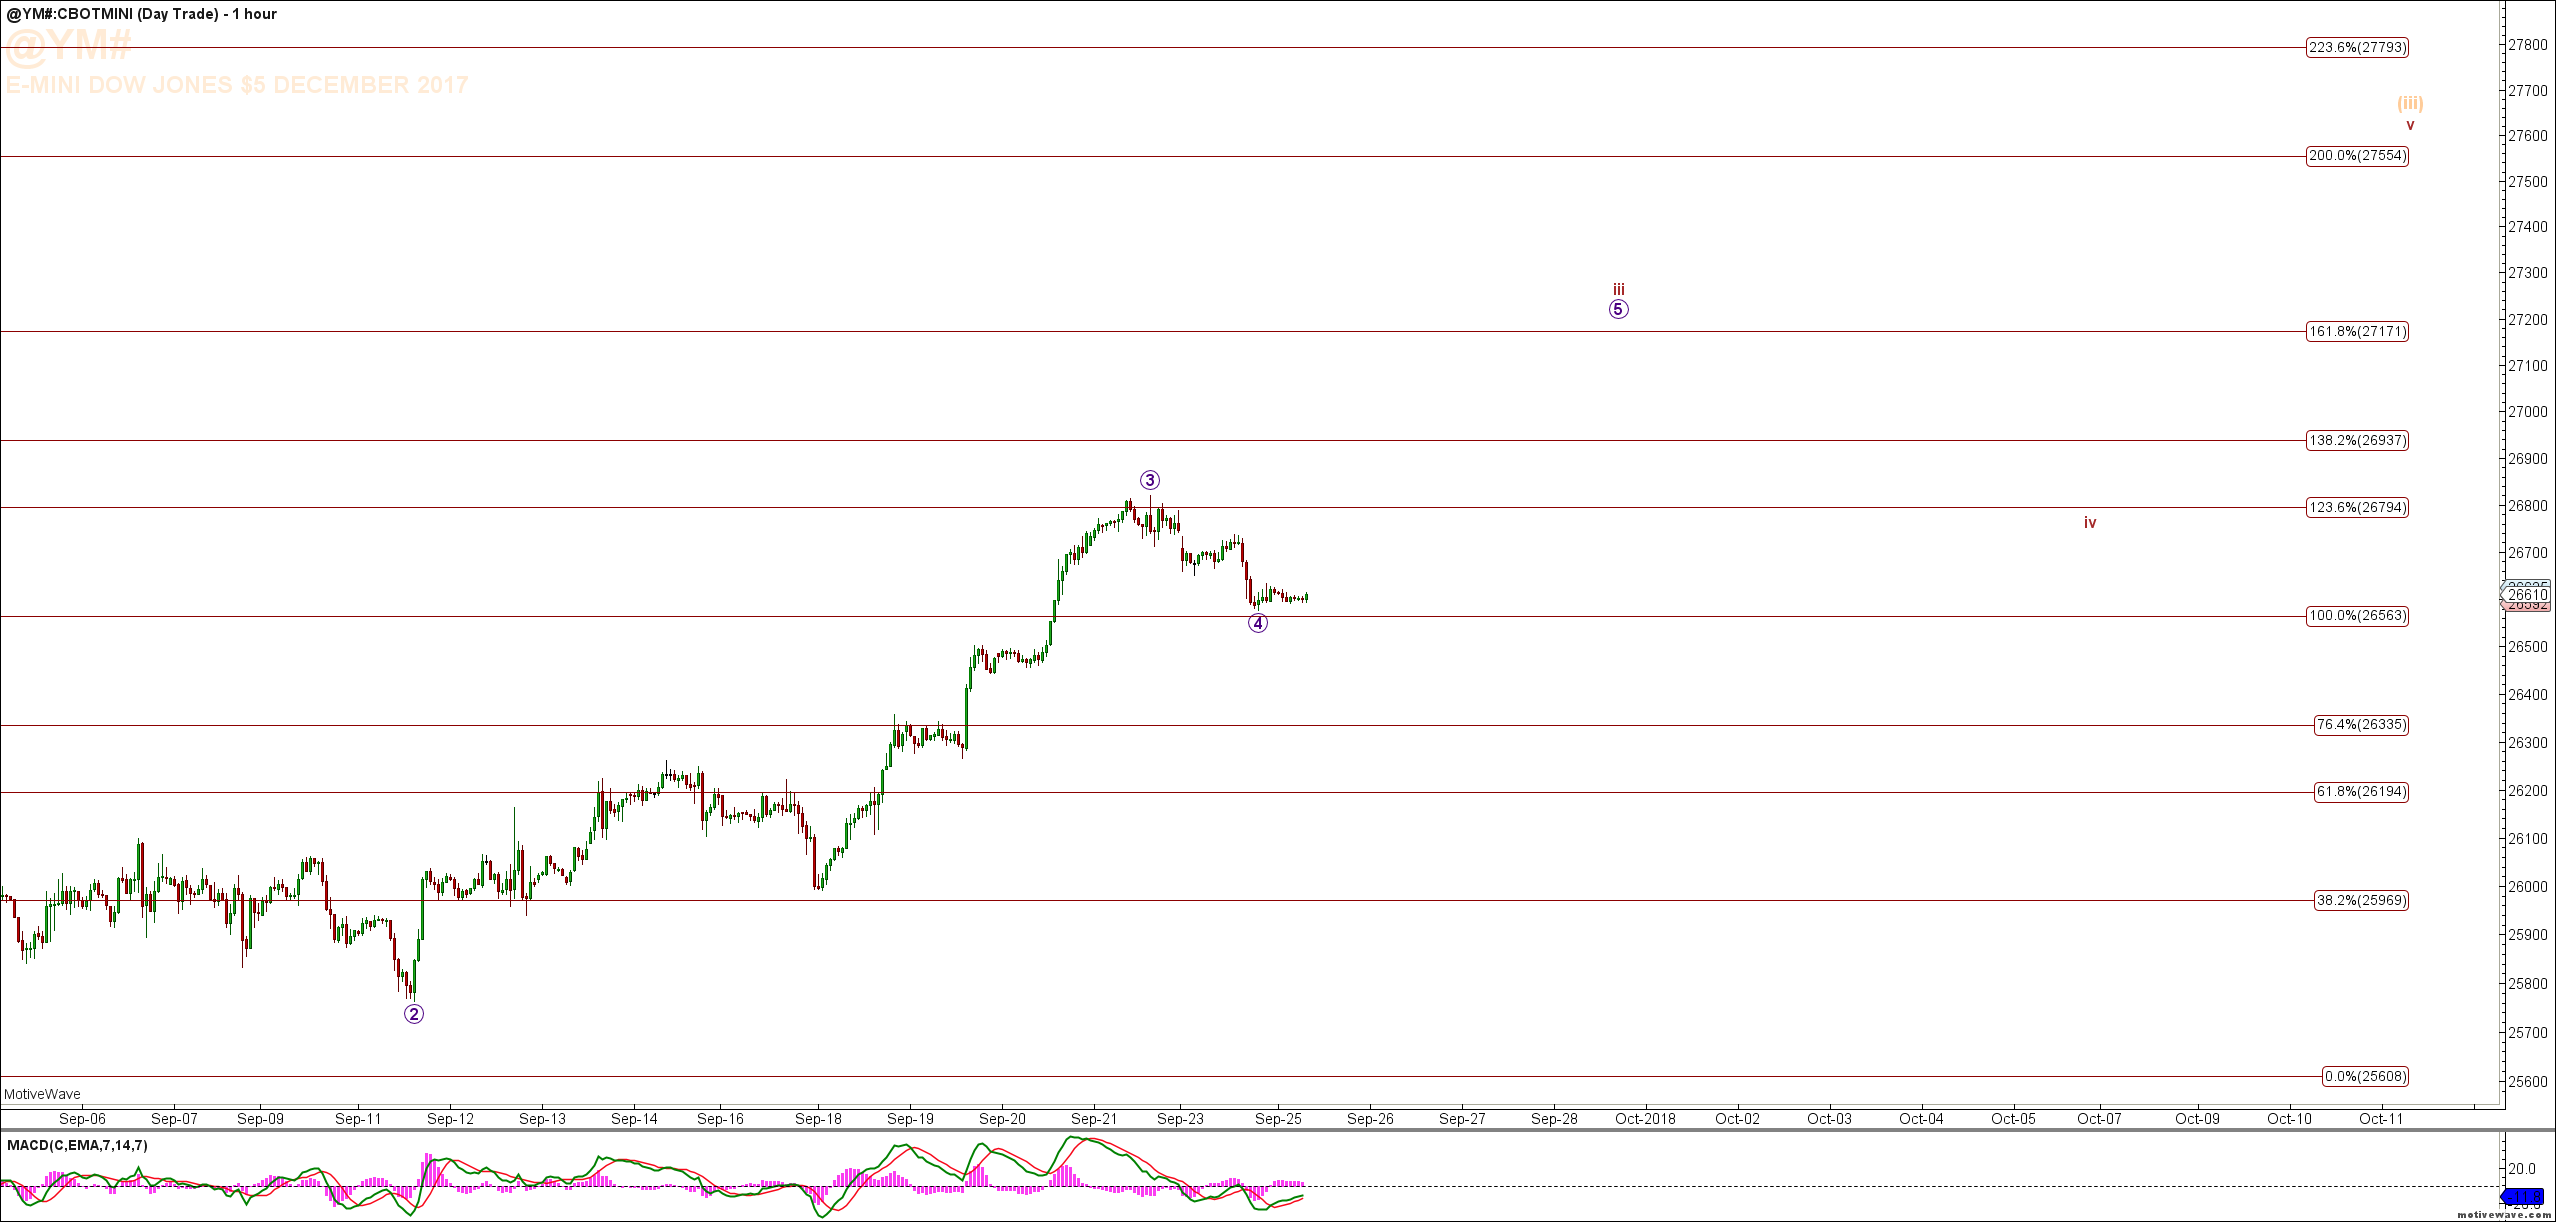
The YM came up and hit the 123.6% extension at Fridays high for the completion of the Micro Degree Wave 3 and has since pulled back slightly in the Micro Degree Wave 4. Looking for the YM to remain above 25563 and then push higher towards the 161.8% extension next at 27171 in the Micro Degree Wave 5 which will then also complete all of the Sub Minuette Degree Wave iii.

Write comment Views: 1981 Comments: 0

ES (E-Mini) Charts with Elliott Wave Counts & Video

Mike Richards on 24/09/2018 2034 days ago

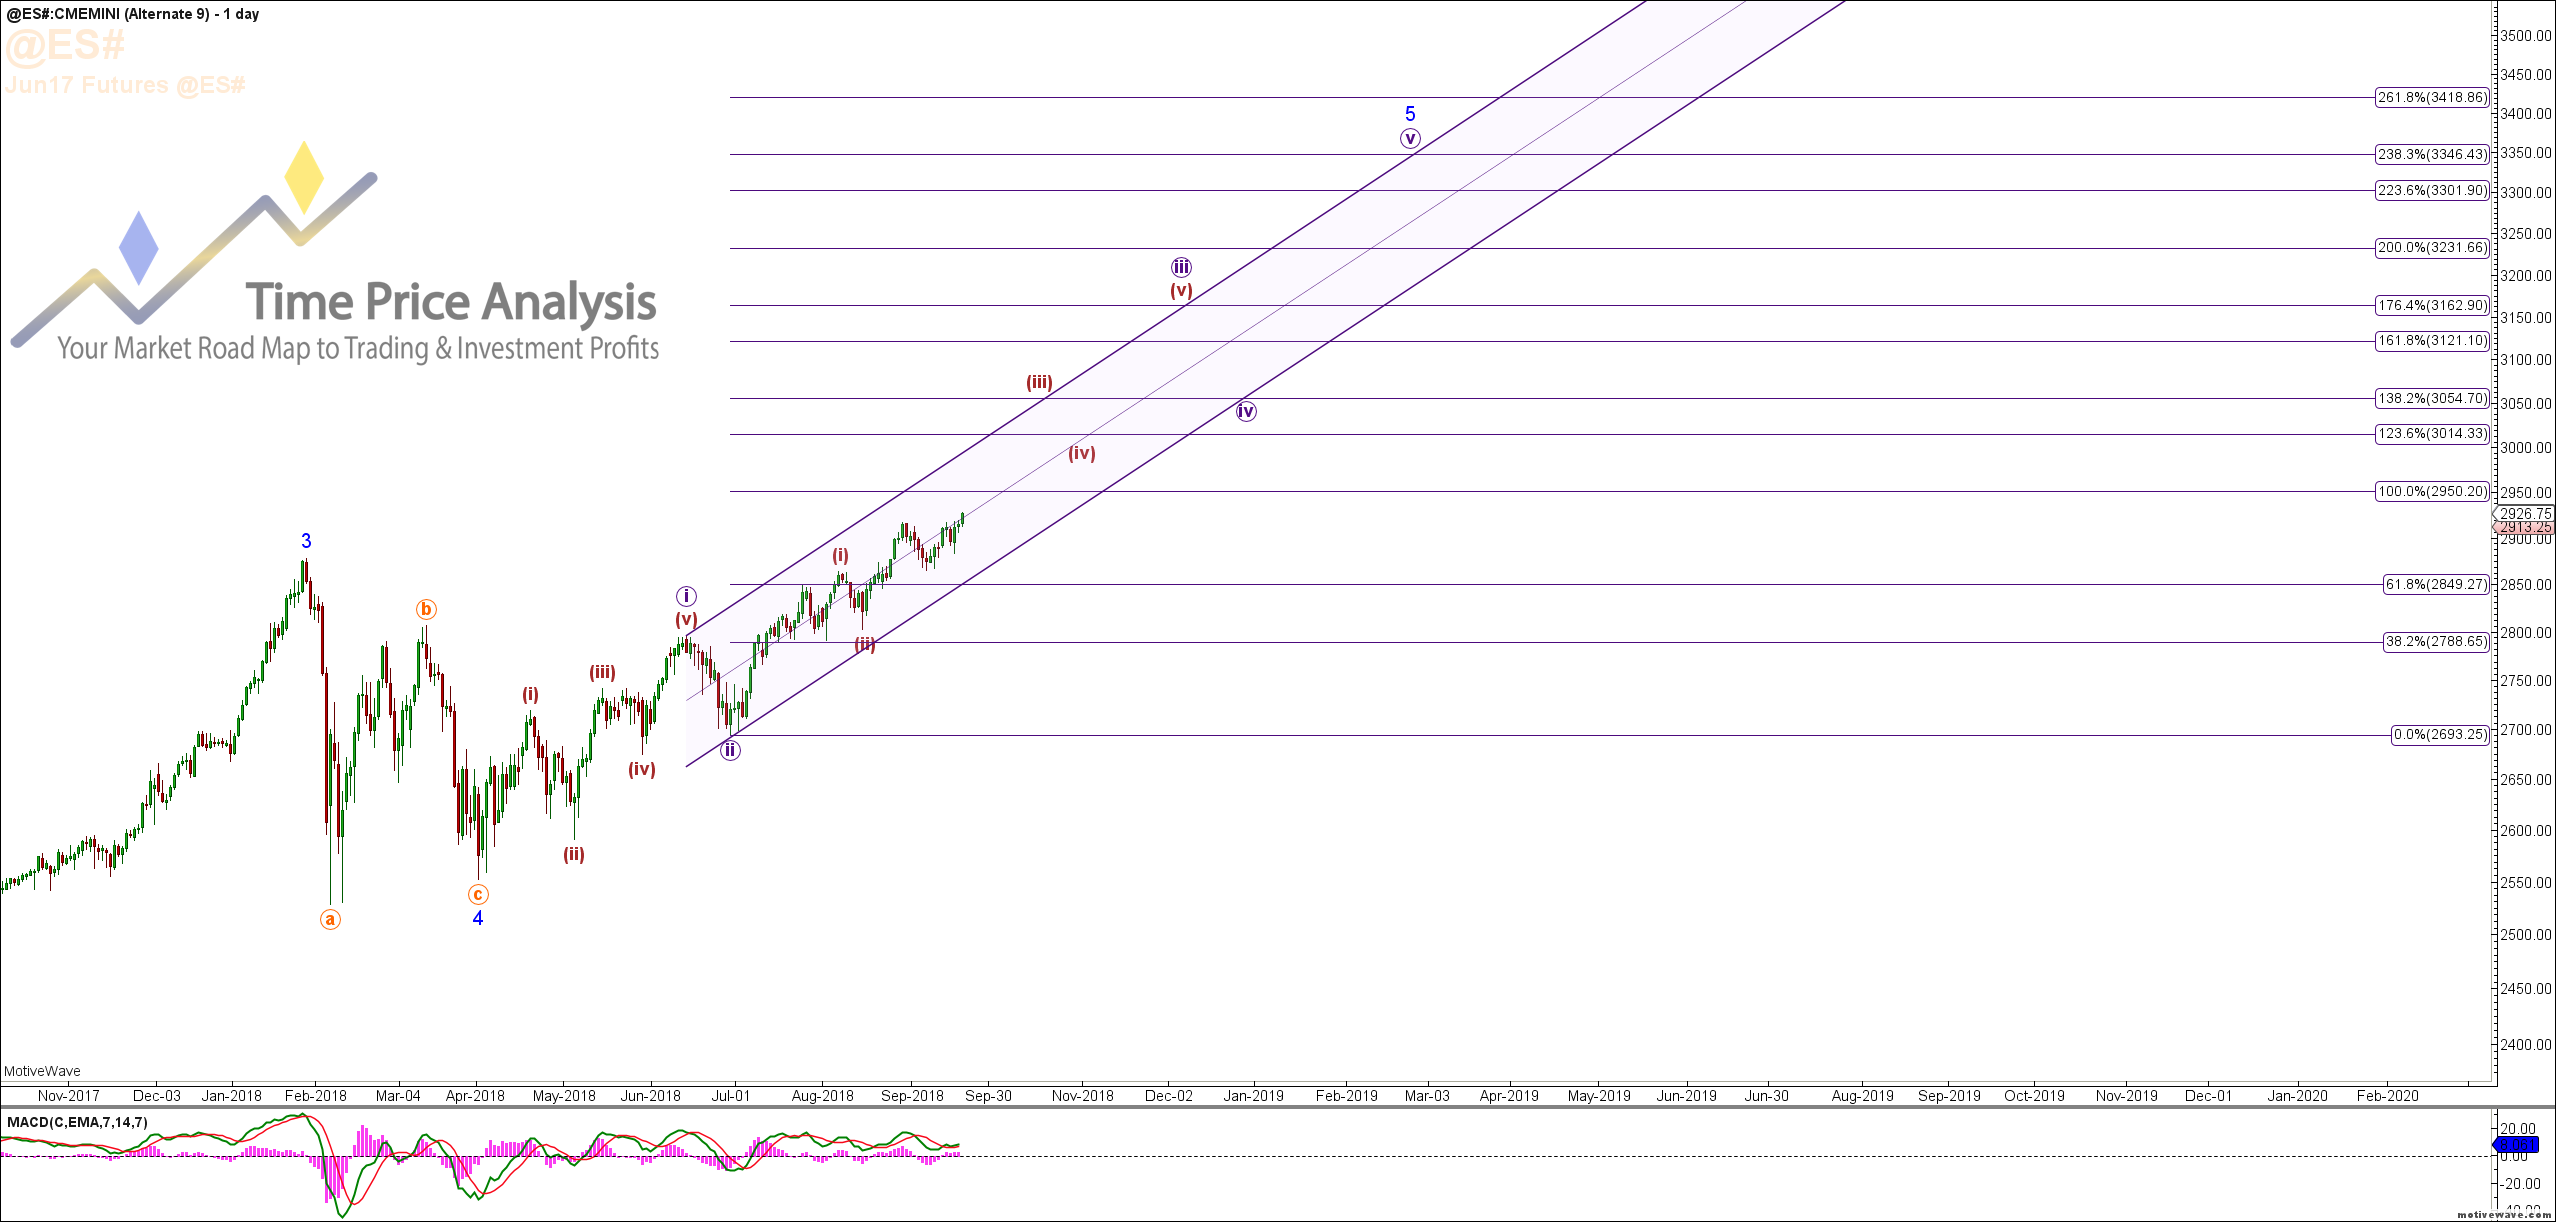
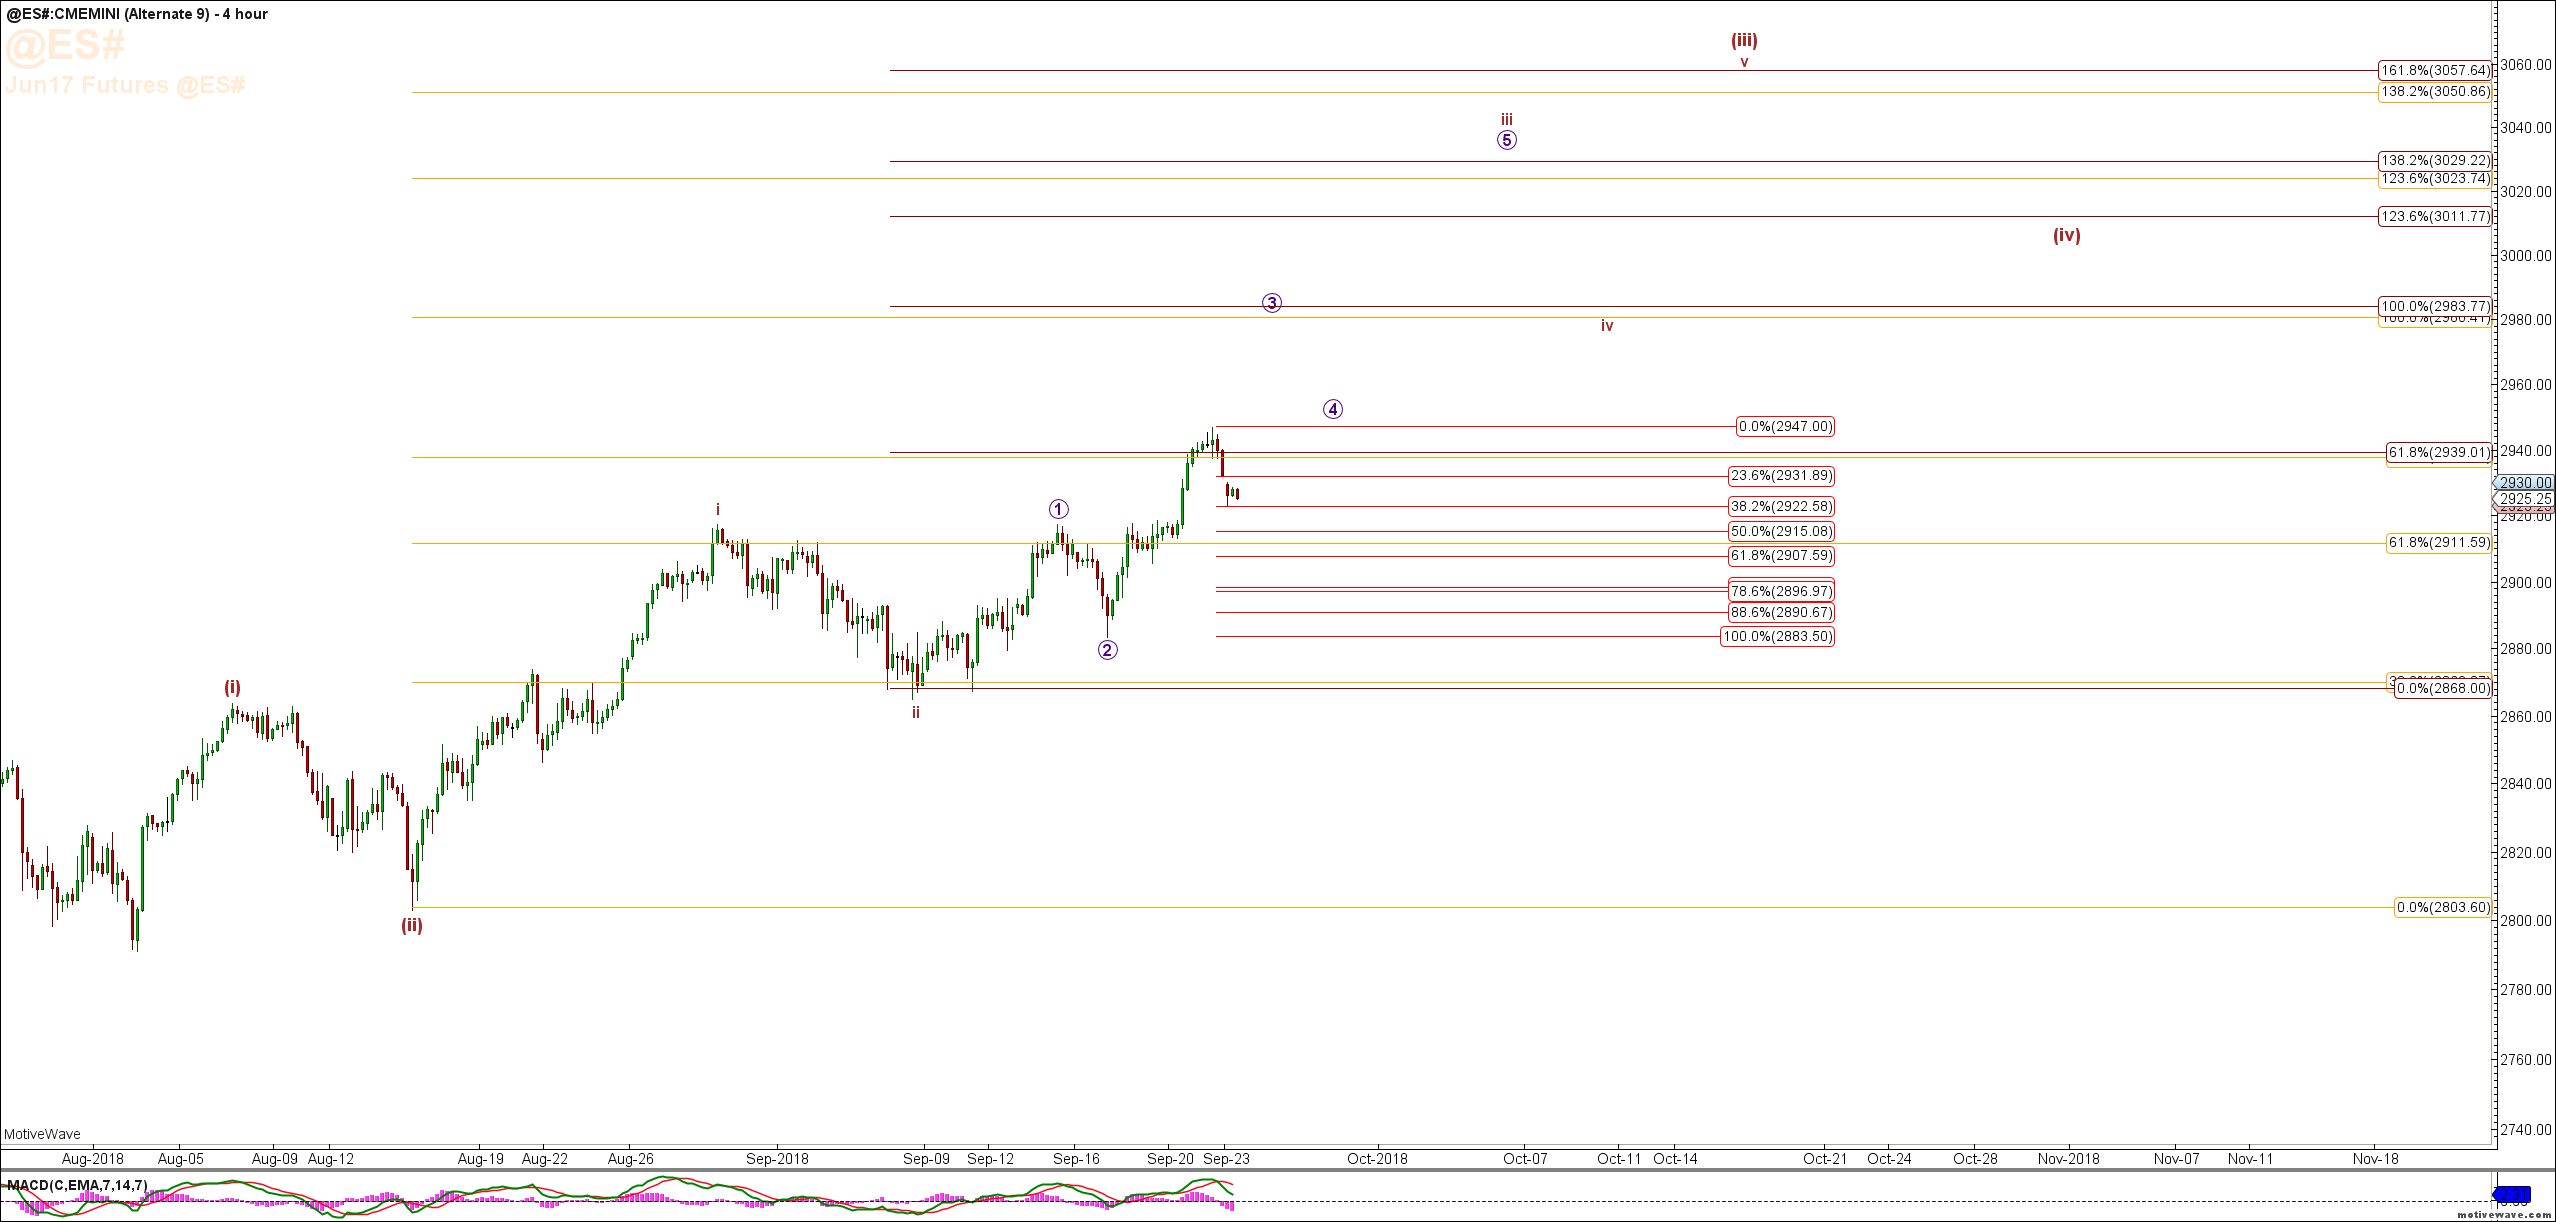
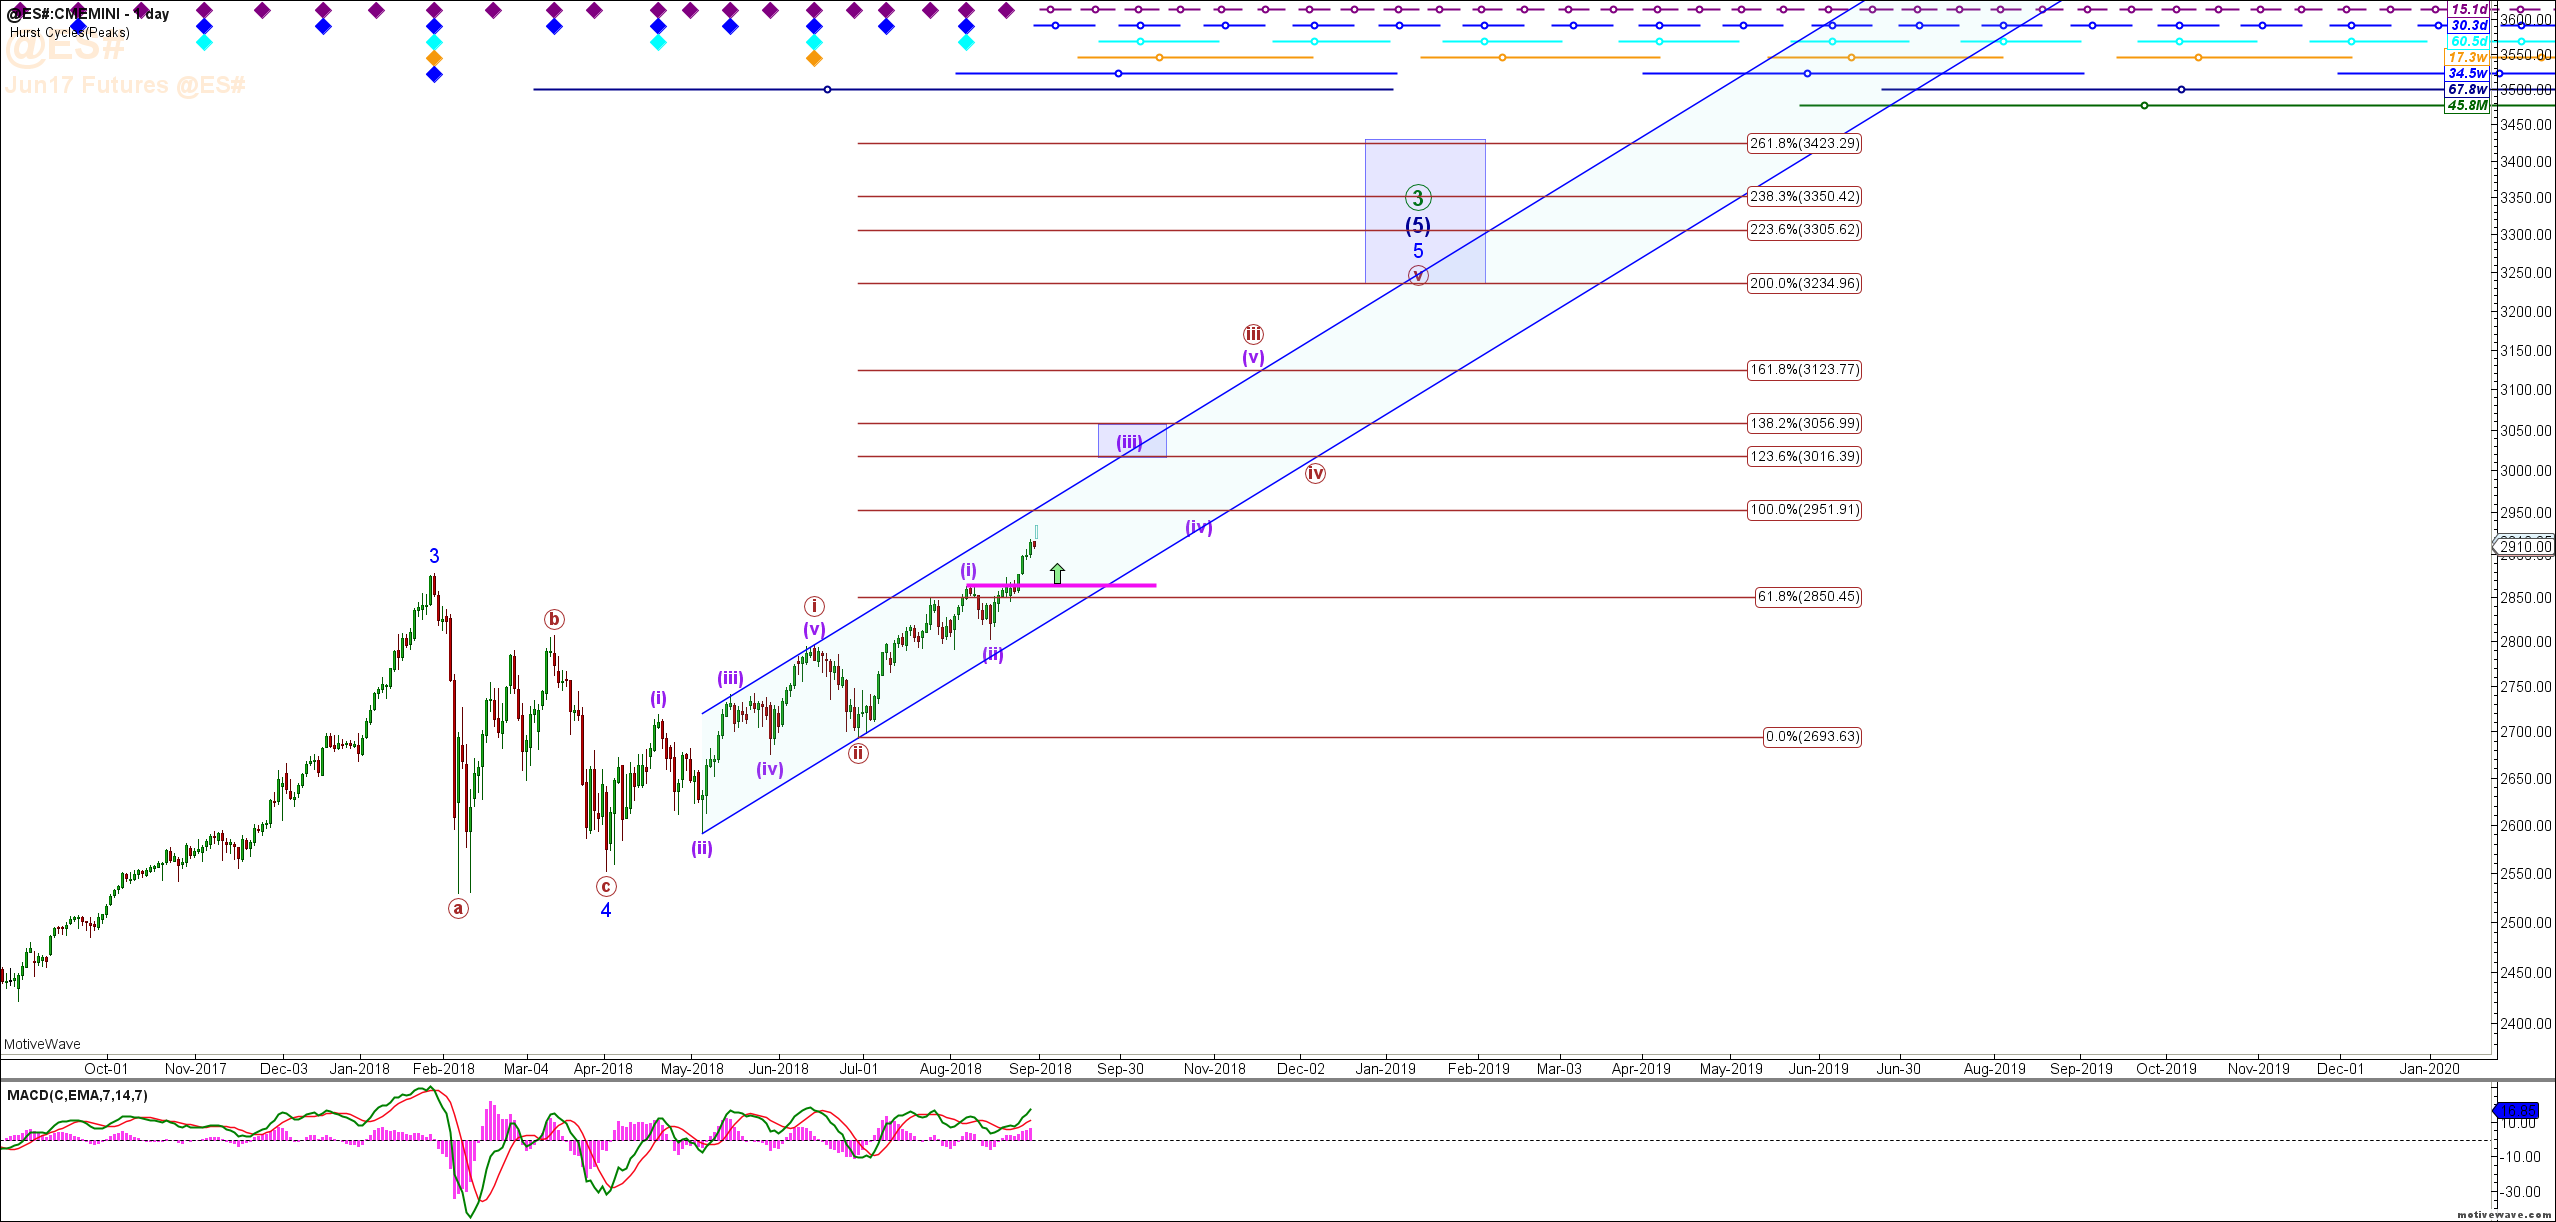
The ES looks about to break out in the continuation of the Minuette Degree Wave (iii) of the Minute Degree Wave III within the Minor Degree 5th Wave up off the April Lows (See daily Chart). Looking at the 240 & 60 Minute Charts i am looking for the ES to take out yesterdays high at 2919.25 and grind up towards the 2983 area next in the Micro Degree Wave 3.

Yesterday we did indeed see the ES breakout in the Micro Degree Wave 3

Write comment Views: 5188 Comments: 0

Gold - GC Charts & Update

Mike Richards on 17/09/2018 2041 days ago

Gold (GC) Charts & Update:

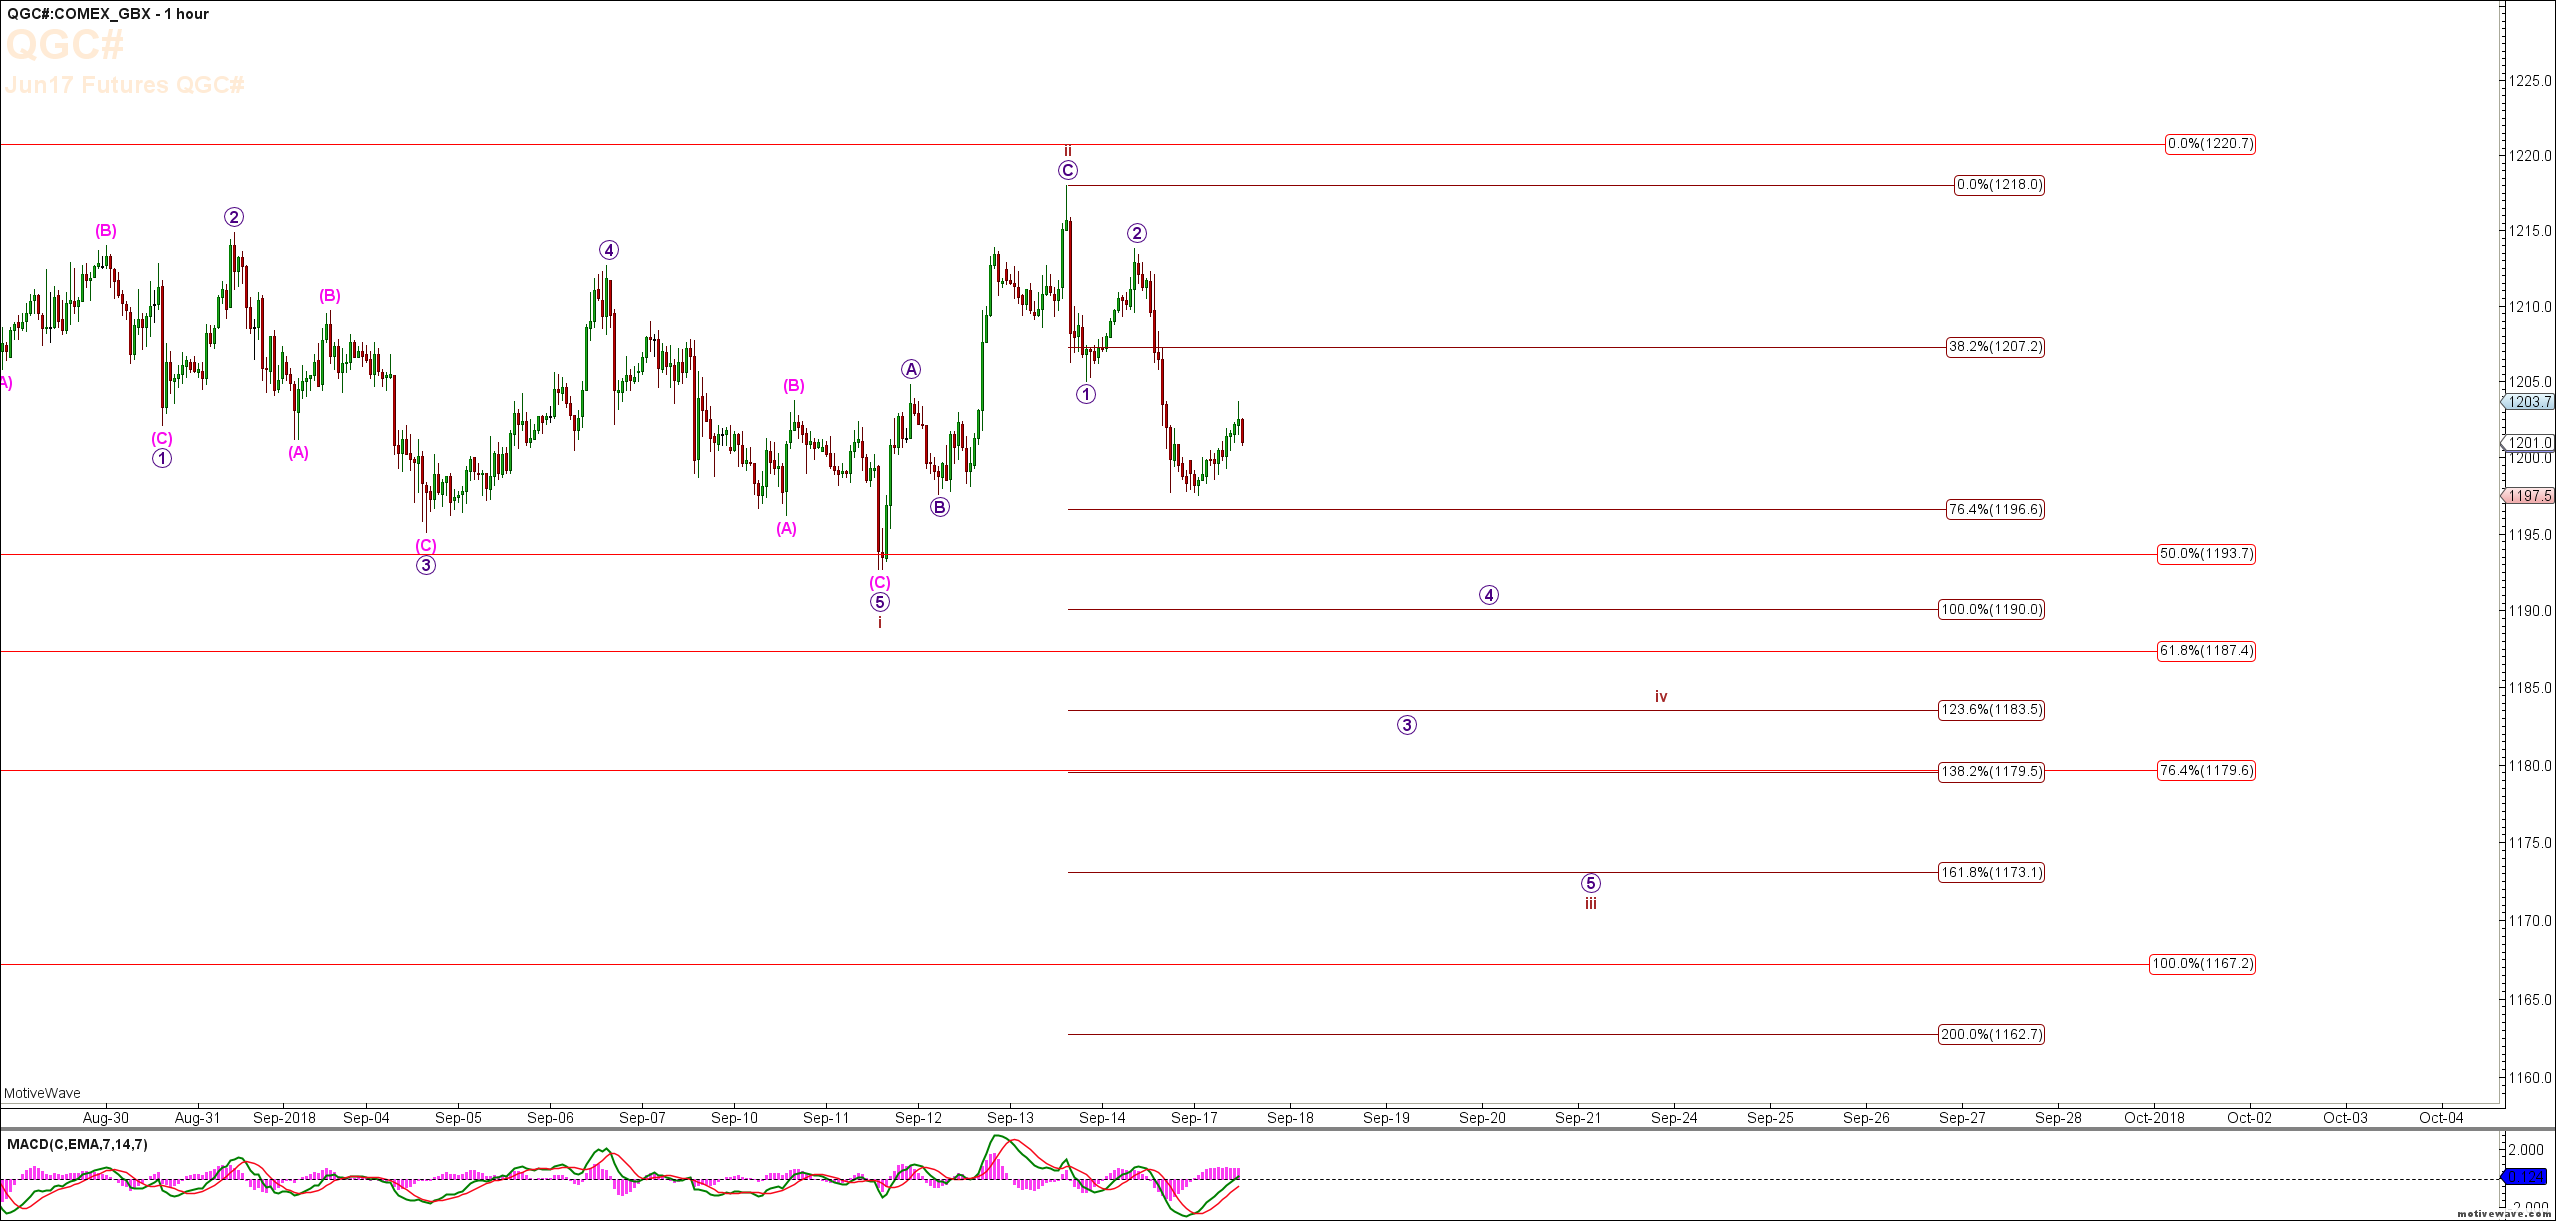
GC now has a leading diagonal down for the i of 5, a deep ii back followed by a micro 1, 2 down. Looking for GC to remain below 1218 and continue lower from here. See this morning's charts and video below. 

Write comment Views: 1740 Comments: 0

ES - S&P 500 - Elliott Wave Charts & Video

Mike Richards on 13/09/2018 2045 days ago

ES Charts & Update:

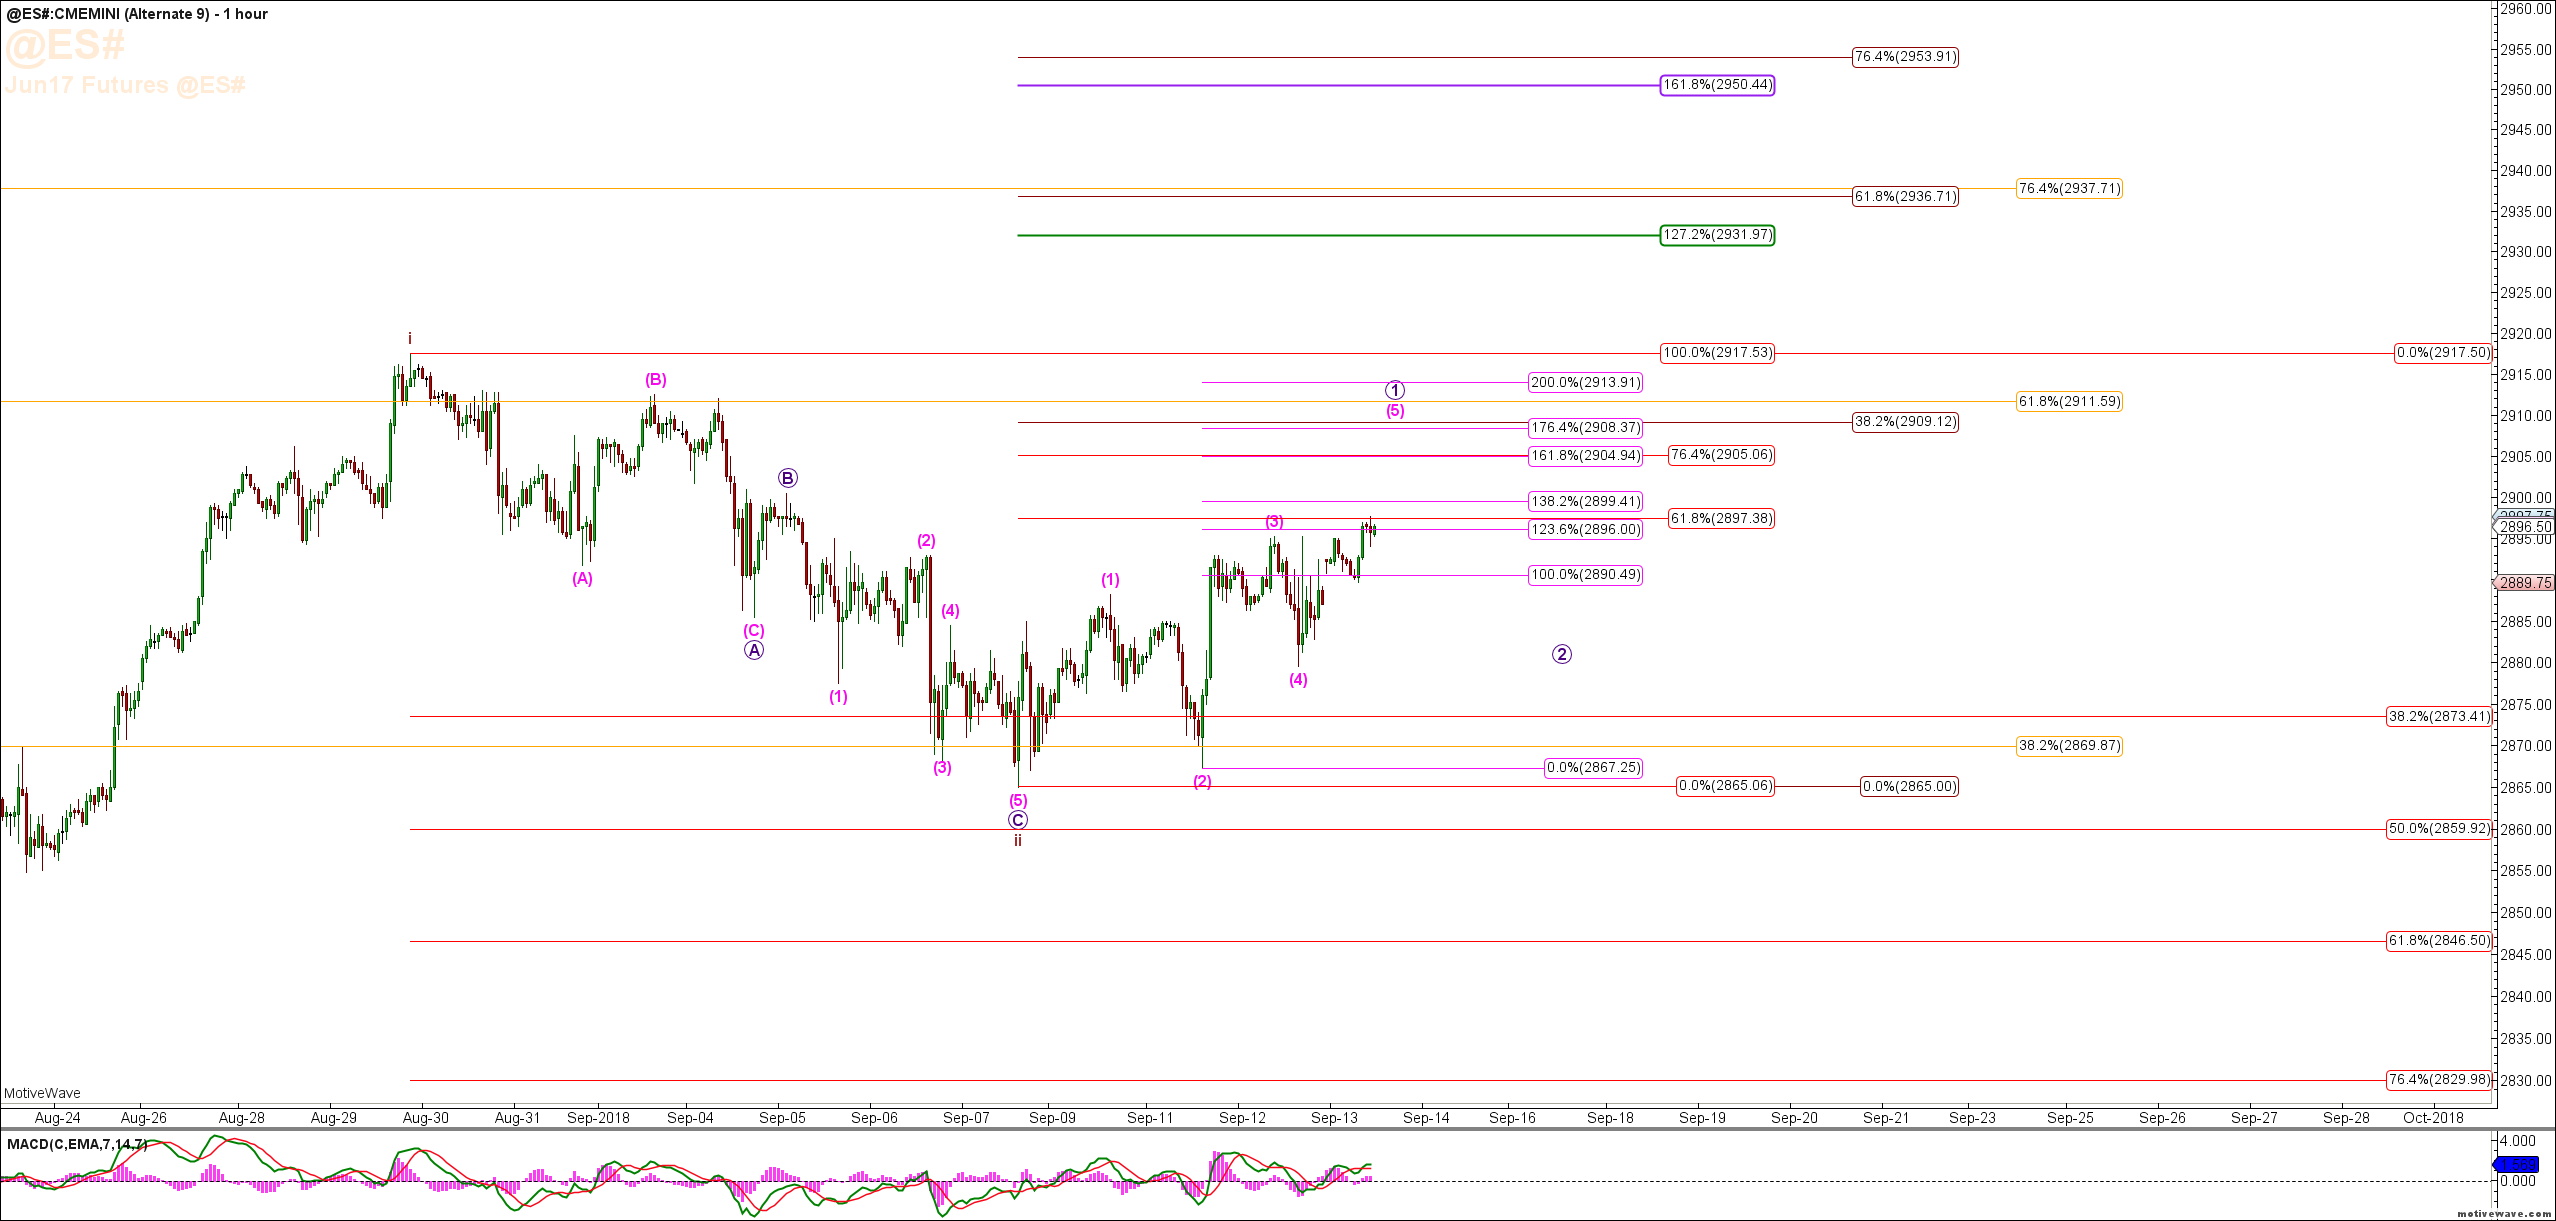
Now looking for the rest of the 5th up towards 2809 in this leading diagonal before we then see a pullback in the 2.

Login or start your Free Trial to see the Day Trade Chart for ES and access all of our in-depth charts, Elliott Wave setups, Fibonacci Levels, Hurst Cycles, and more including our Live Trading Room where you watch our screens as we trade live and show you the market direction in real time. 

Write comment Views: 4311 Comments: 0

Crude Oil Elliott Wave Counts, Charts, and Video

Mike Richards on 12/09/2018 2046 days ago

CL Charts & Morning Update:

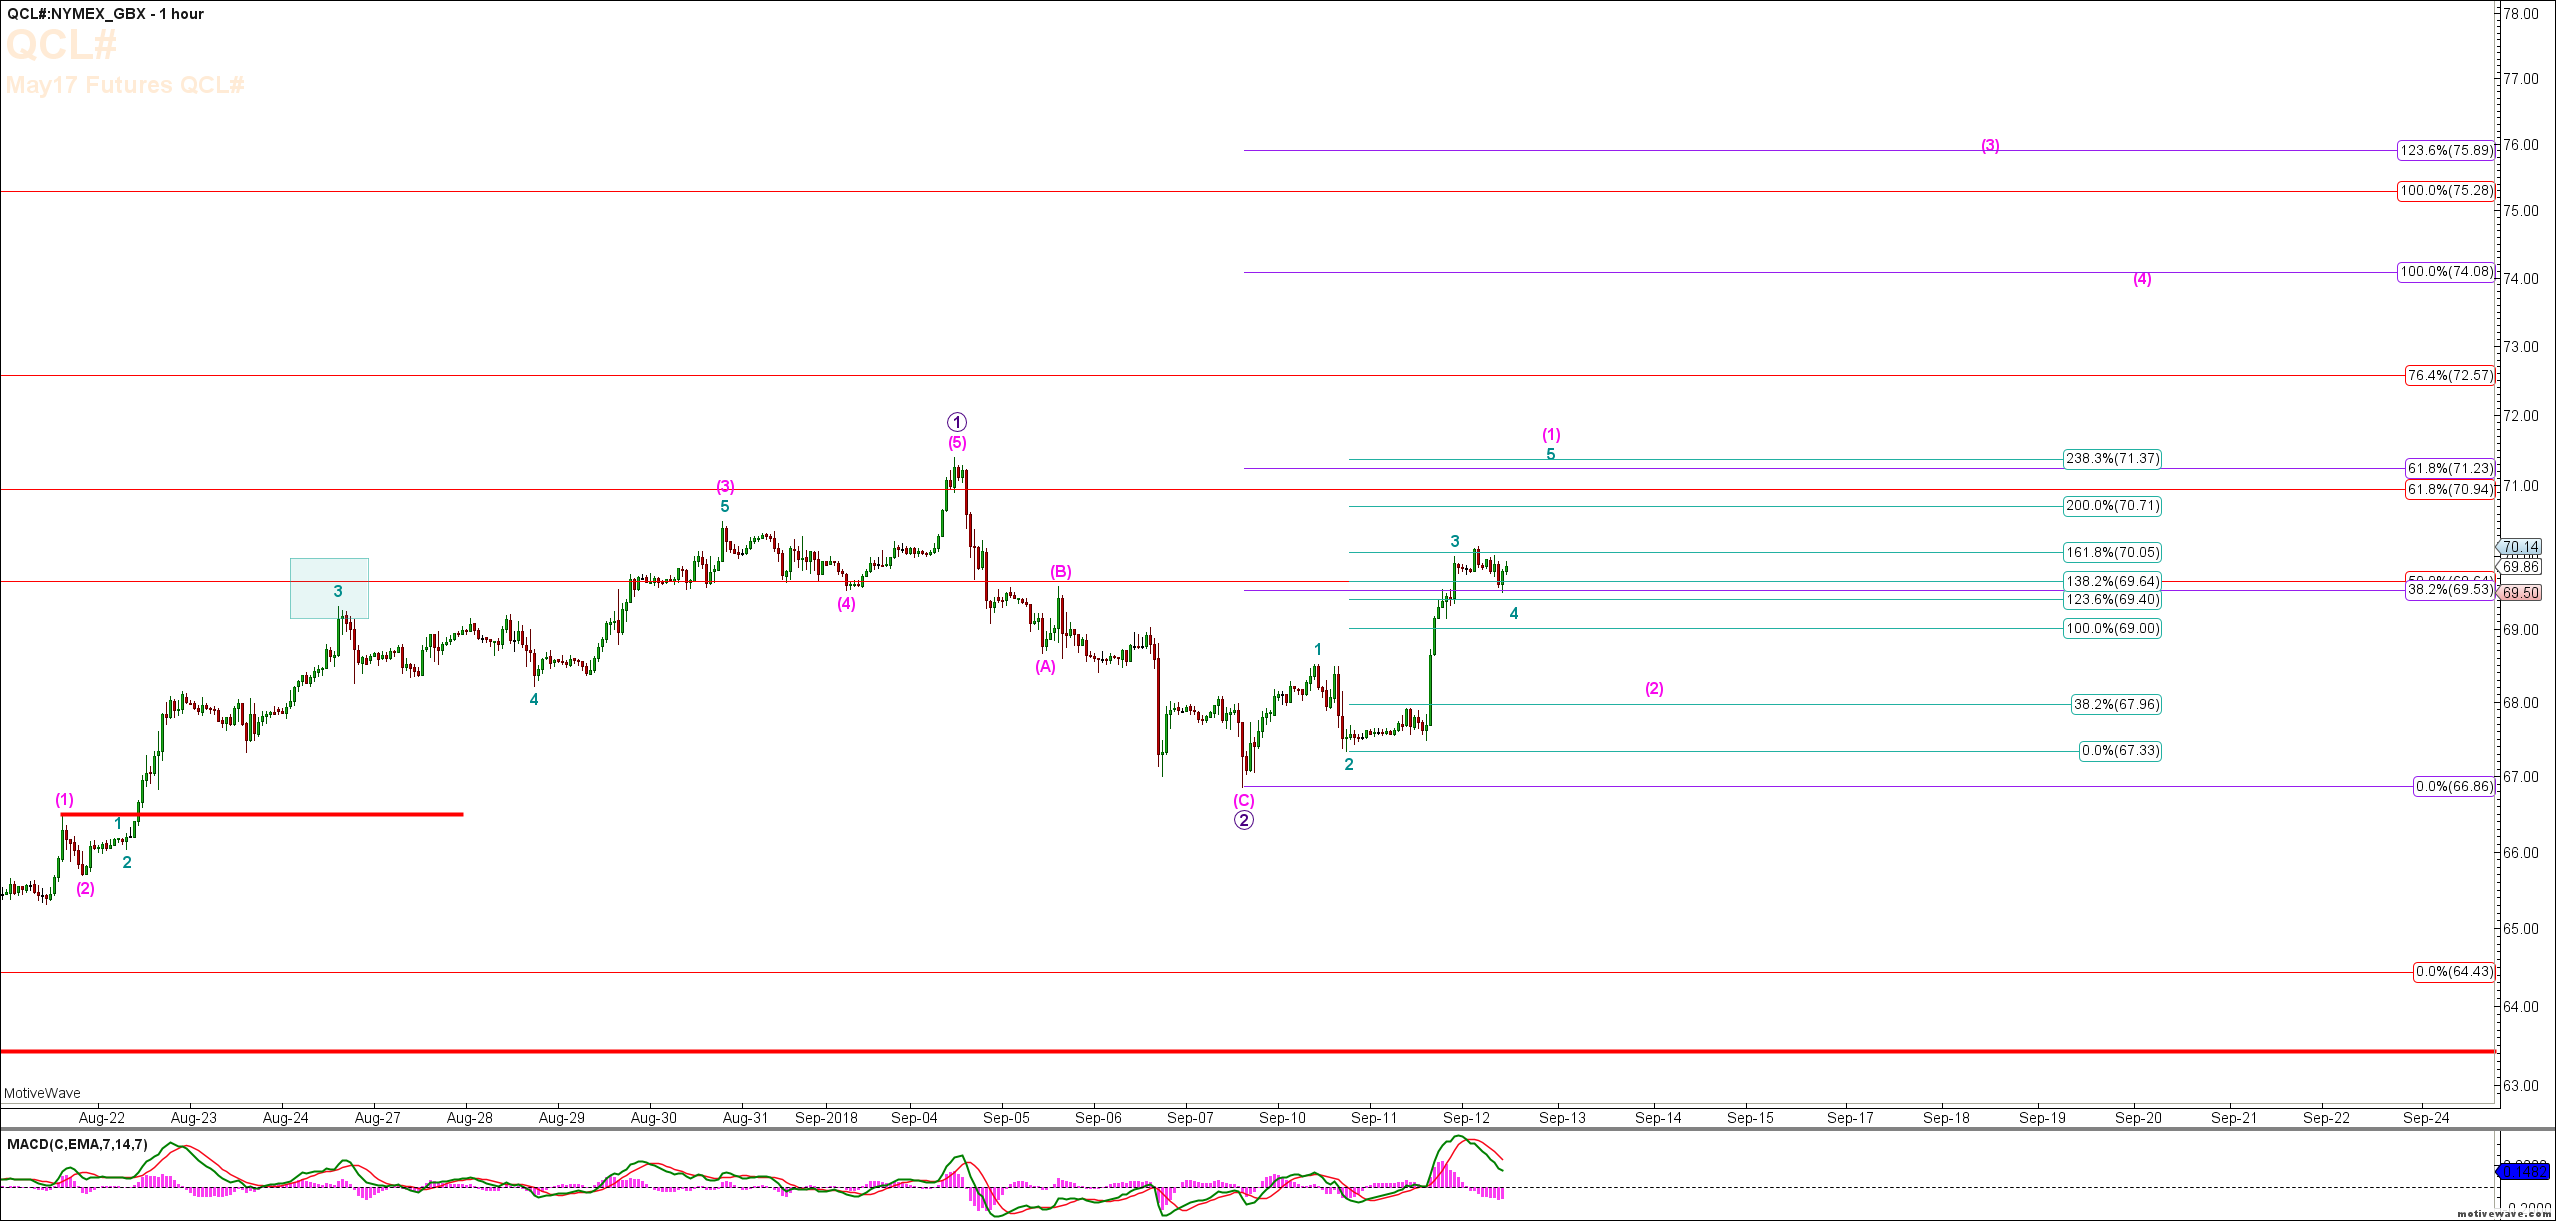
CL has now moved up strongly from the recent low in what looks to be an unfolding impulse as shown in the 15 & 60 Minute Charts. Looking for the final 5th up to complete all of the Wave (1) of the larger degree C of 5 (Daily Chart).

Write comment Views: 4832 Comments: 0

S&P Breakout Target Levels And Timing - How And When To Rotate For Exceptional Returns

Brian Fletcher on 07/09/2018 2051 days ago

Summary

  • Timing and target levels for the S&P 500 Stock Index.
  • Cash is an investment choice as well.
  • Two alternatives for great returns during an overall correction in the S&P 500 Stock Index.
Write comment Views: 4510 Comments: 0

German DAX Charts & Morning Update

Mike Richards on 06/09/2018 2052 days ago
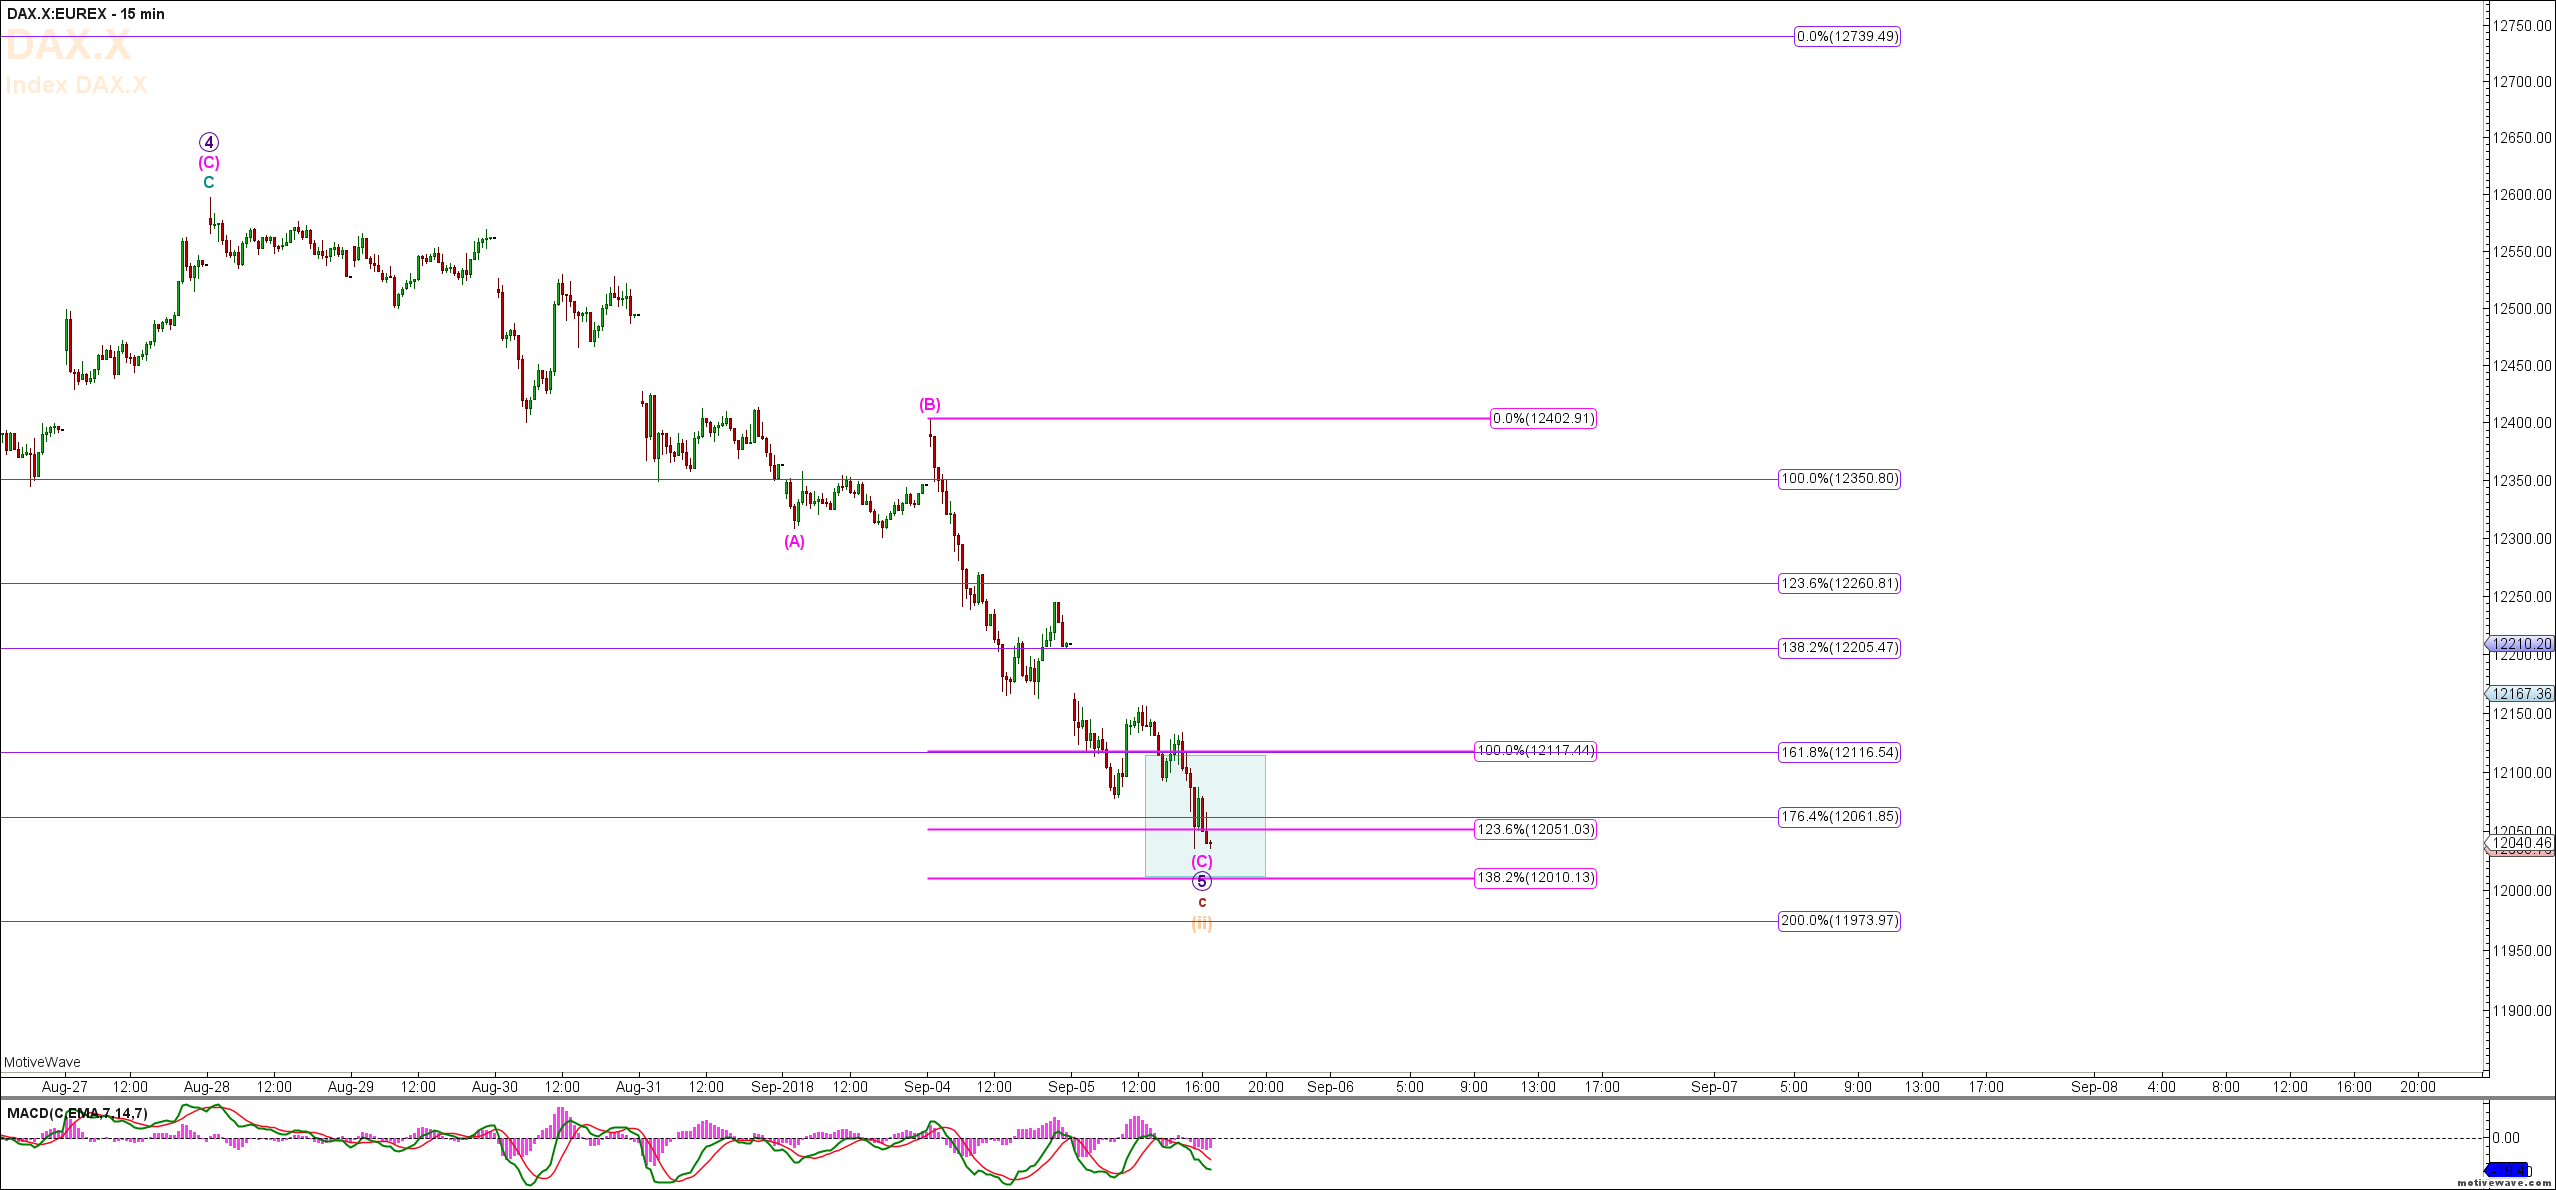
German DAX Futures are trading lower again in pre-market this morning. The DAX has now come down very deep against the move up into the May 22nd high and yesterday hit the 78.6% retracement of that move up. The next Fibonacci levels support is at 11887. Looking for the DAX to turn back up and then trade over 12400 in order to confirm that this is the Minuette Degree Wave (ii). The invalidation level for this count in the DAX is at 11723. The charts with the Elliott Wave Counts and Fibonacci levels are below for multiple time frames as well as the segmet from the Pre US Open Video outlining the day for the DAX and UKX (FTSE).
Write comment Views: 1773 Comments: 0

Natural Gas – Short Term Downside Setup At Hand

Brian Fletcher on 05/09/2018 2053 days ago

Natural Gas has offered numerous opportunities for traders and investors alike this year. This past Friday we (at Time Price Analysis) recommended shares of DGAZ to our subscribers at $21.28, and now have a break even stop with no risk in the trade. For futures traders, NG setup the perfect entry as well.

Write comment Views: 7257 Comments: 0

Bit Coin Charts & Morning Update

Mike Richards on 03/09/2018 2055 days ago
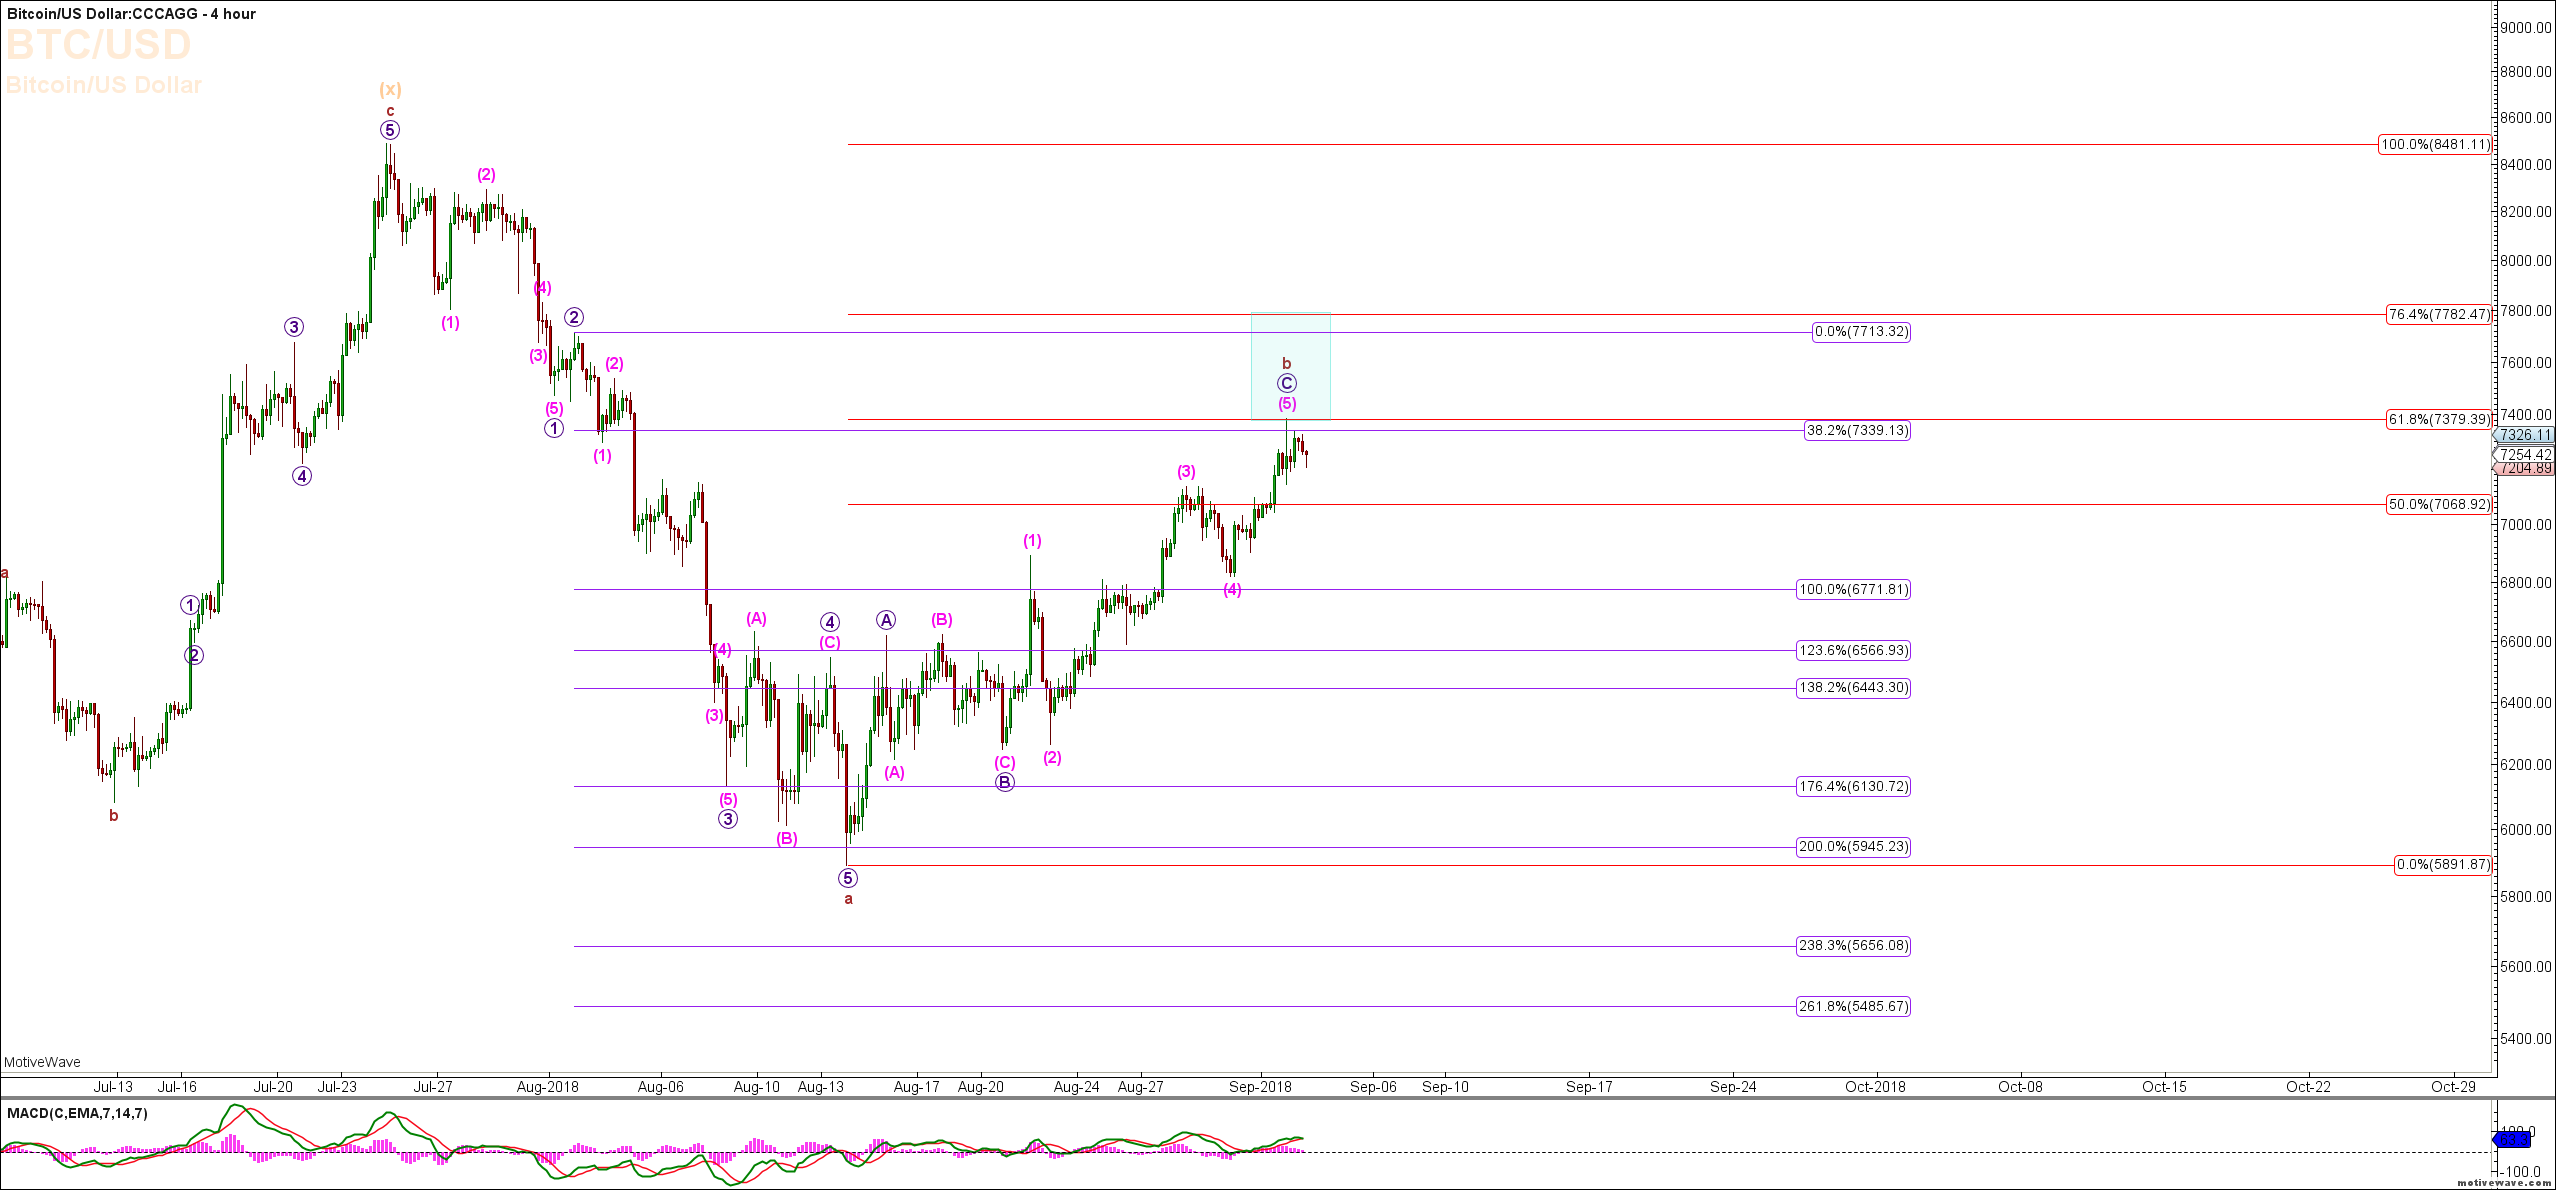
BitCoin complete the Sub Micro Degree Wave (4) and then pushed up in the Sub Micro Degree Wave (5) and hit the 61.8% retrace fib at the bottom of our target zone for the possible completion of all of the sub minuette degree b Wave and has now turned lower. Confirmation that we are now in the Sub Minuette Degree Wave C (See daily Chart) would be a break of last weeks low at 6818 followed by a break of 5891. 
Write comment Views: 2180 Comments: 1

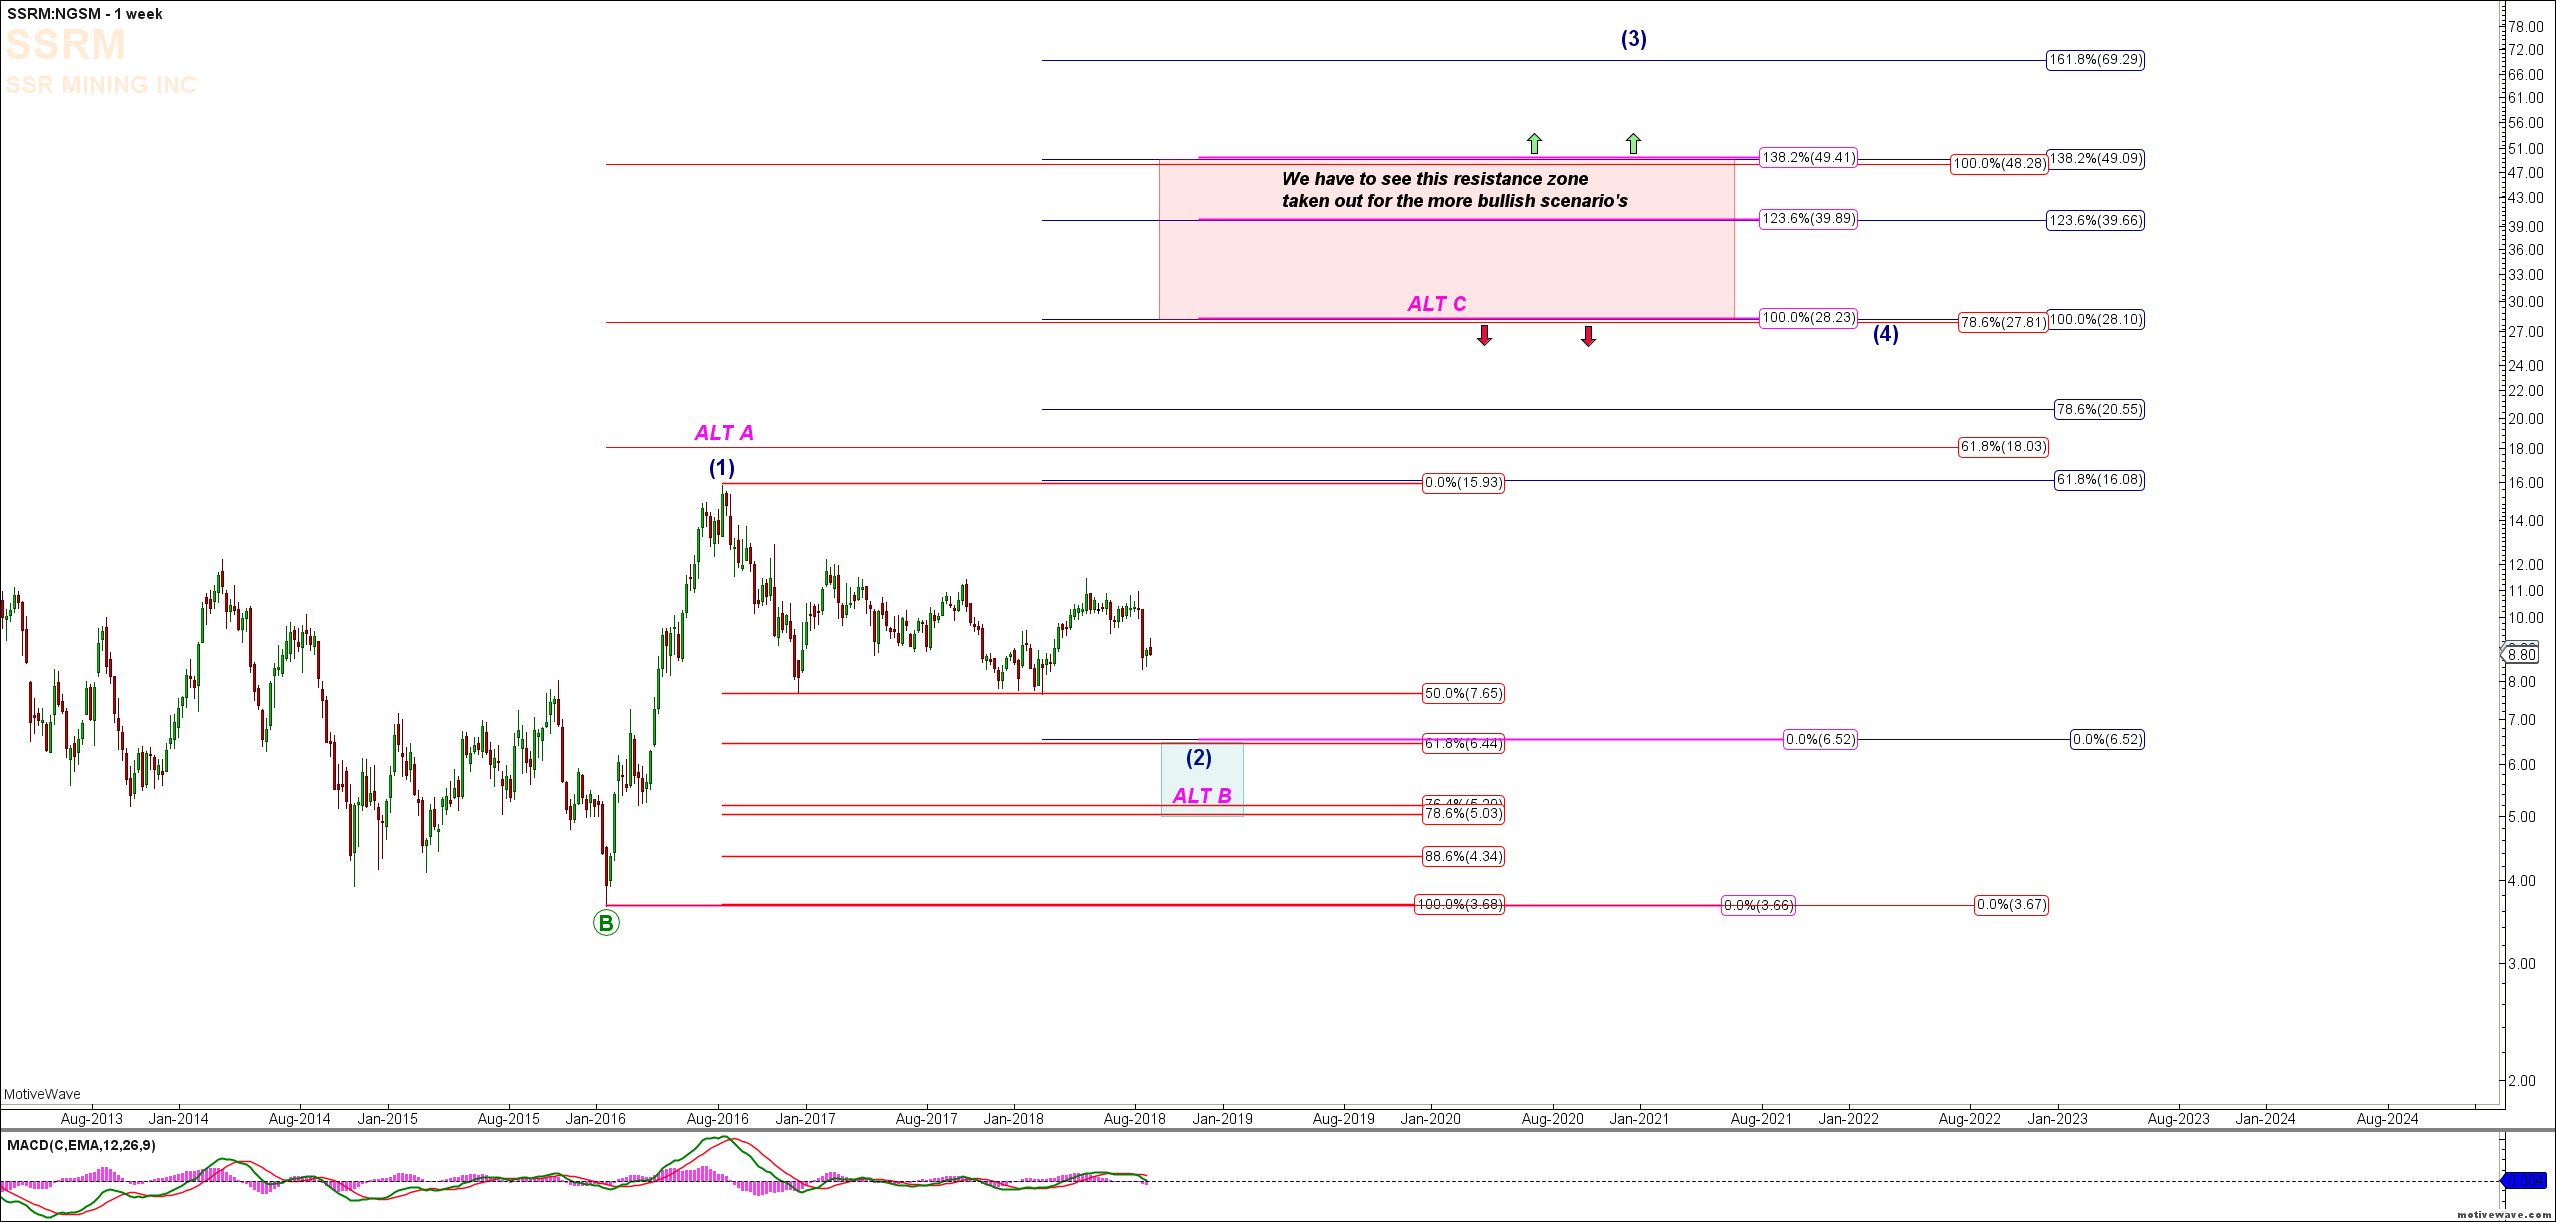
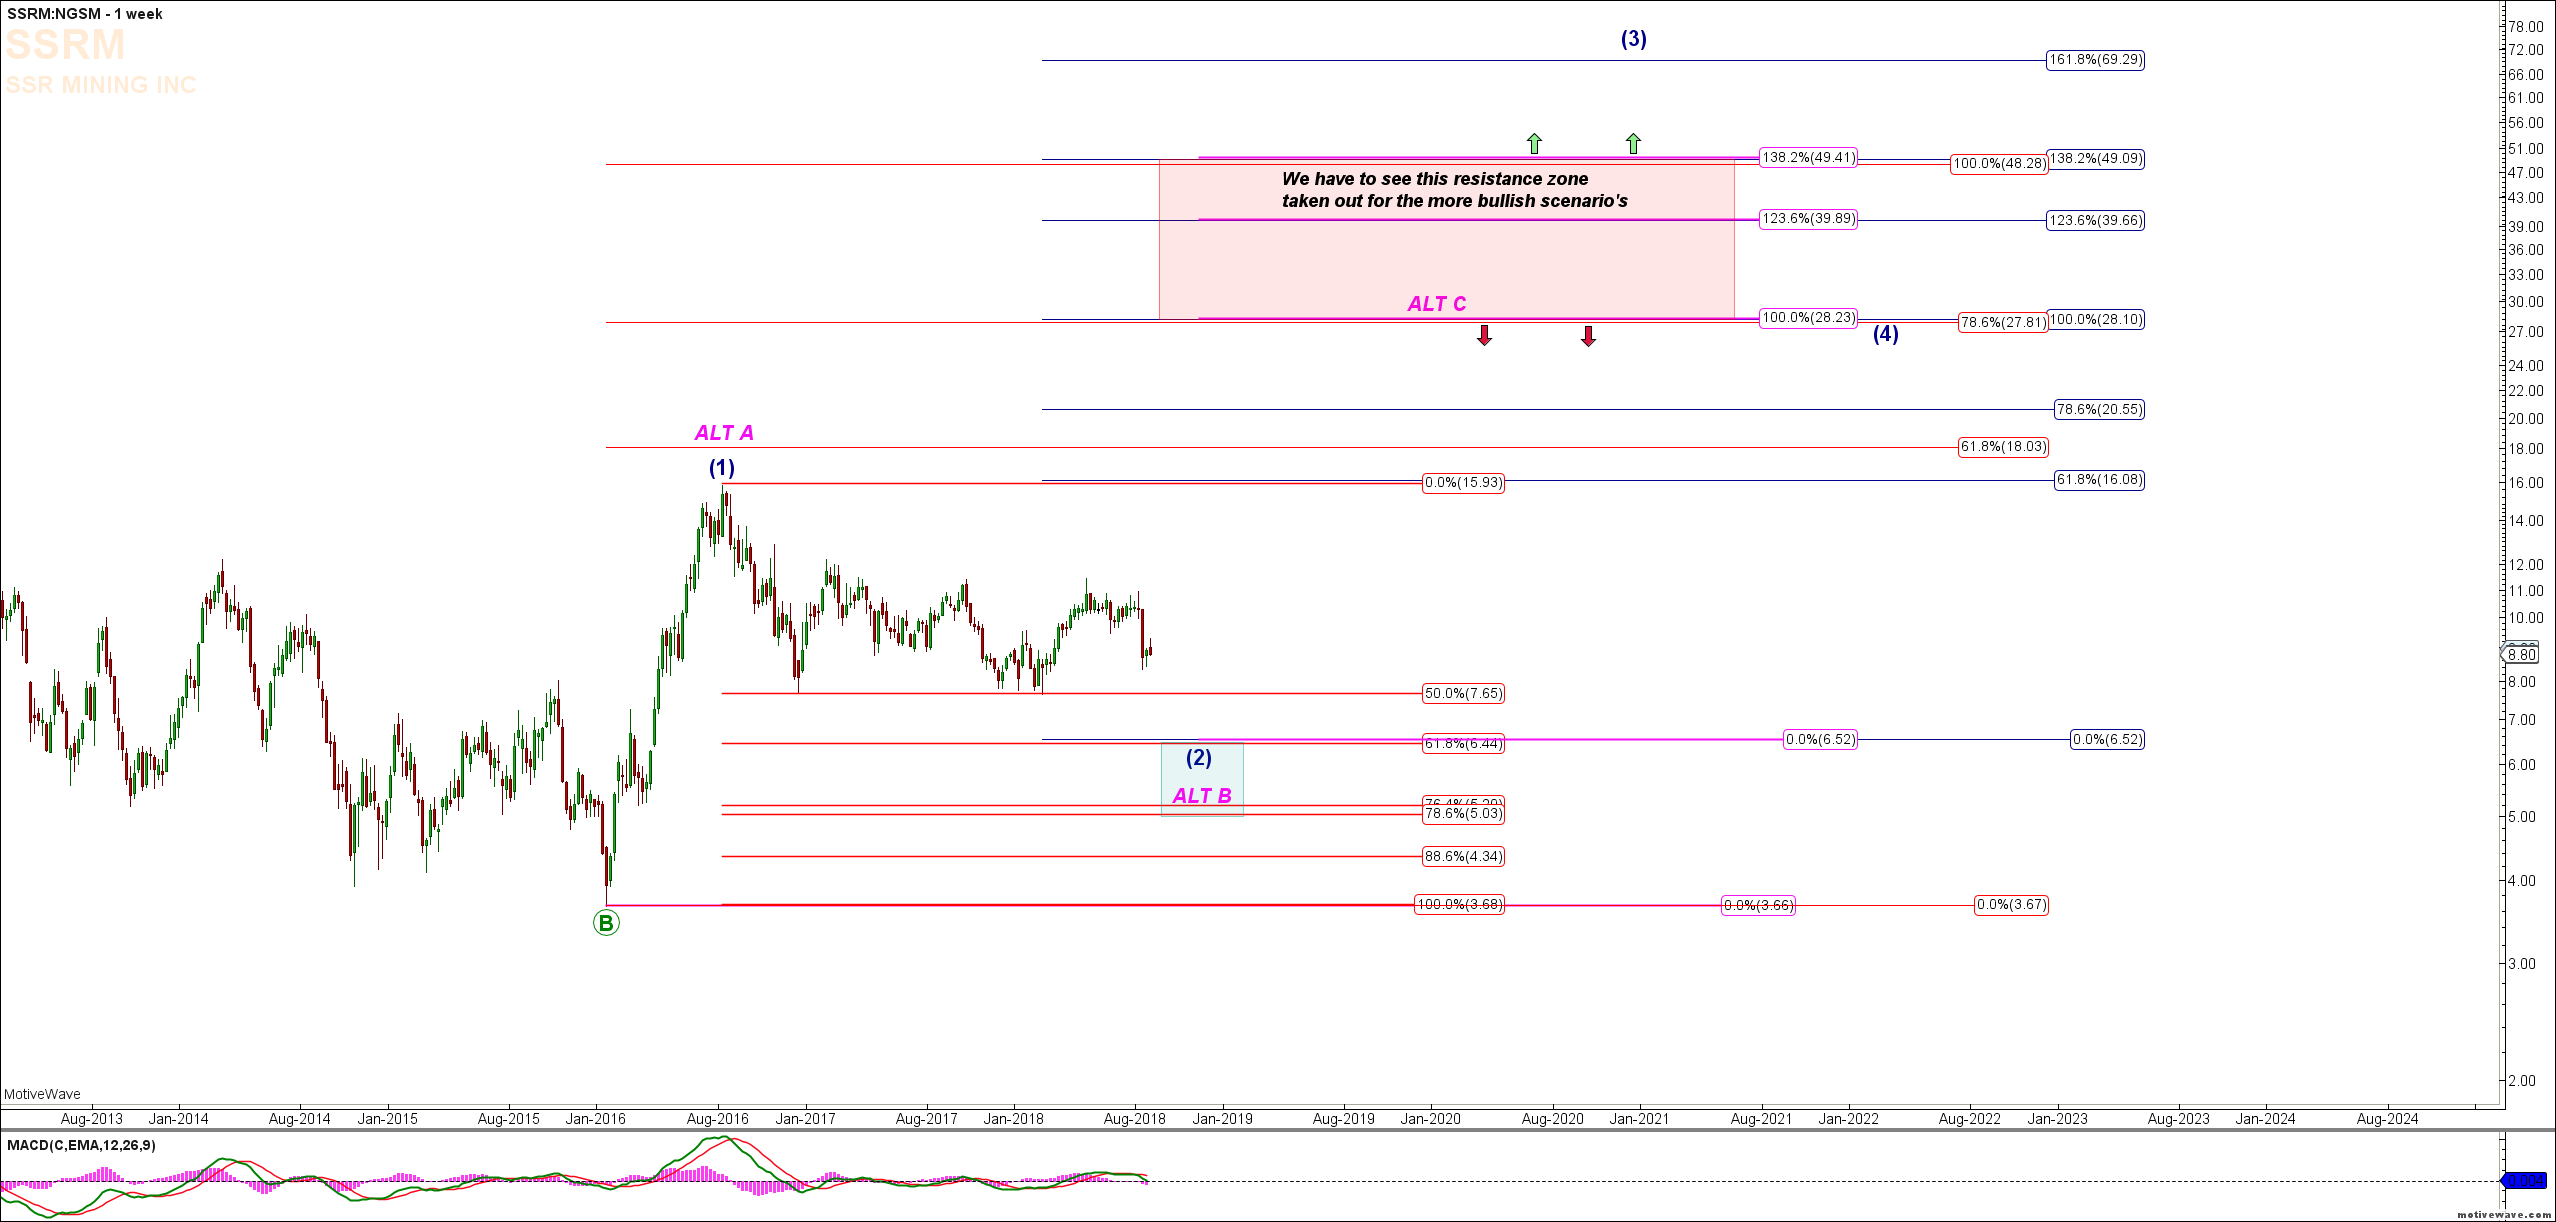
SSRM Mining – Fundamentally and Technically a Strong Buy

Brian Fletcher on 30/08/2018 2059 days ago

In my last article entitled
“Metals and Miners: The Wolf is Close This Time”, I discussed that both the precious metals and precious metals mining sectors are setting up for an enormous move higher in 2019. 
Write comment Views: 7766 Comments: 0

S&P 500 Upside Breakout - Don't Lose your Core Positions - Yet!

Brian Fletcher on 30/08/2018 2059 days ago
A lot of traders and investors hear the term “Breakout” and wonder what it means.  Intuitively, we know it means that the market has broken through some type of upside resistance.  To use an analogy, imagine a building with three floors, where the market is on the first floor, attempting to break through the ceiling of the 2nd floor. Once it does actually break through what is the ceiling of the first floor and is now on the 2nd floor, the downside support now becomes the 2nd story floor, and the upside becomes the 2nd story ceiling.  
Write comment Views: 4735 Comments: 0

EUR:USD Charts and Updates

Mike Richards on 24/08/2018 2065 days ago

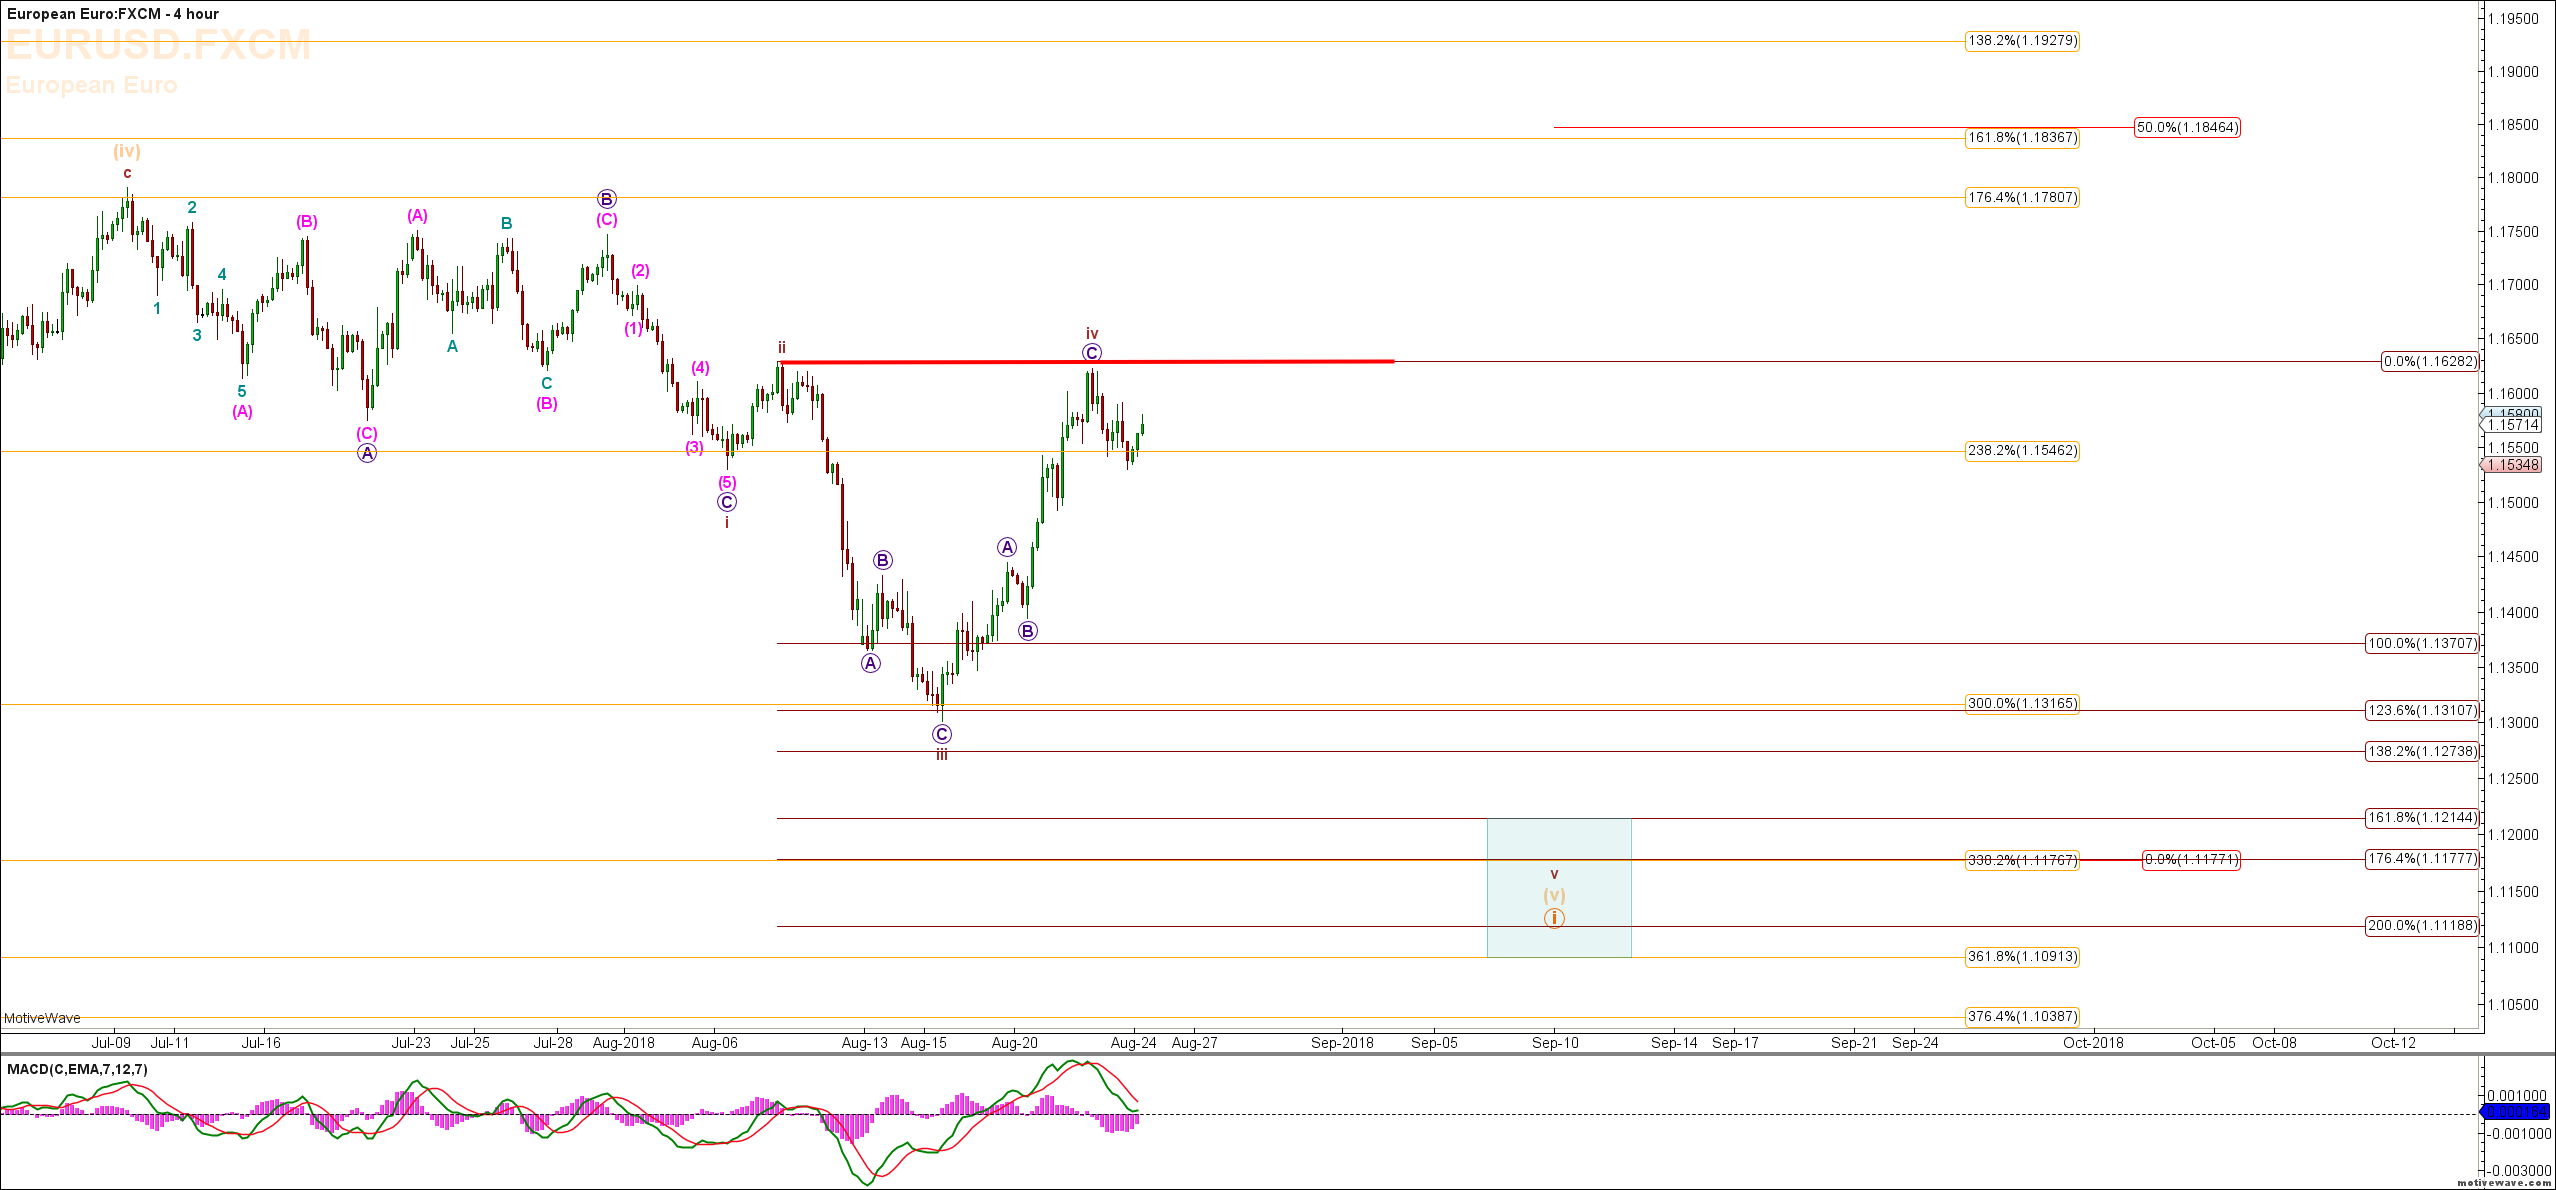
EURUSD Charts & Morning Update:

Yesterday we saw this pair turn back down from just below the invalidation level marked in the 240 & 60 Minute Charts. The recent high should ideally be the top of the Wave IV in an unfolding ending diagonal to complete the Minuette Degree Wave (v) which will then  complete all of the Minute Degree Wave 1 down off the February high. Should we see the EUR:USD take out the invalidation level at 1.1627 then the Minute Degree Wave 1 is already complete at the low seen on 15th August and this move up is part of the Minuette Degree A Wave of the Minute Degree wave 2. 

Write comment Views: 1787 Comments: 0

The S&P Cash Market Is In The Target Zone

Mike Richards on 21/08/2018 2068 days ago
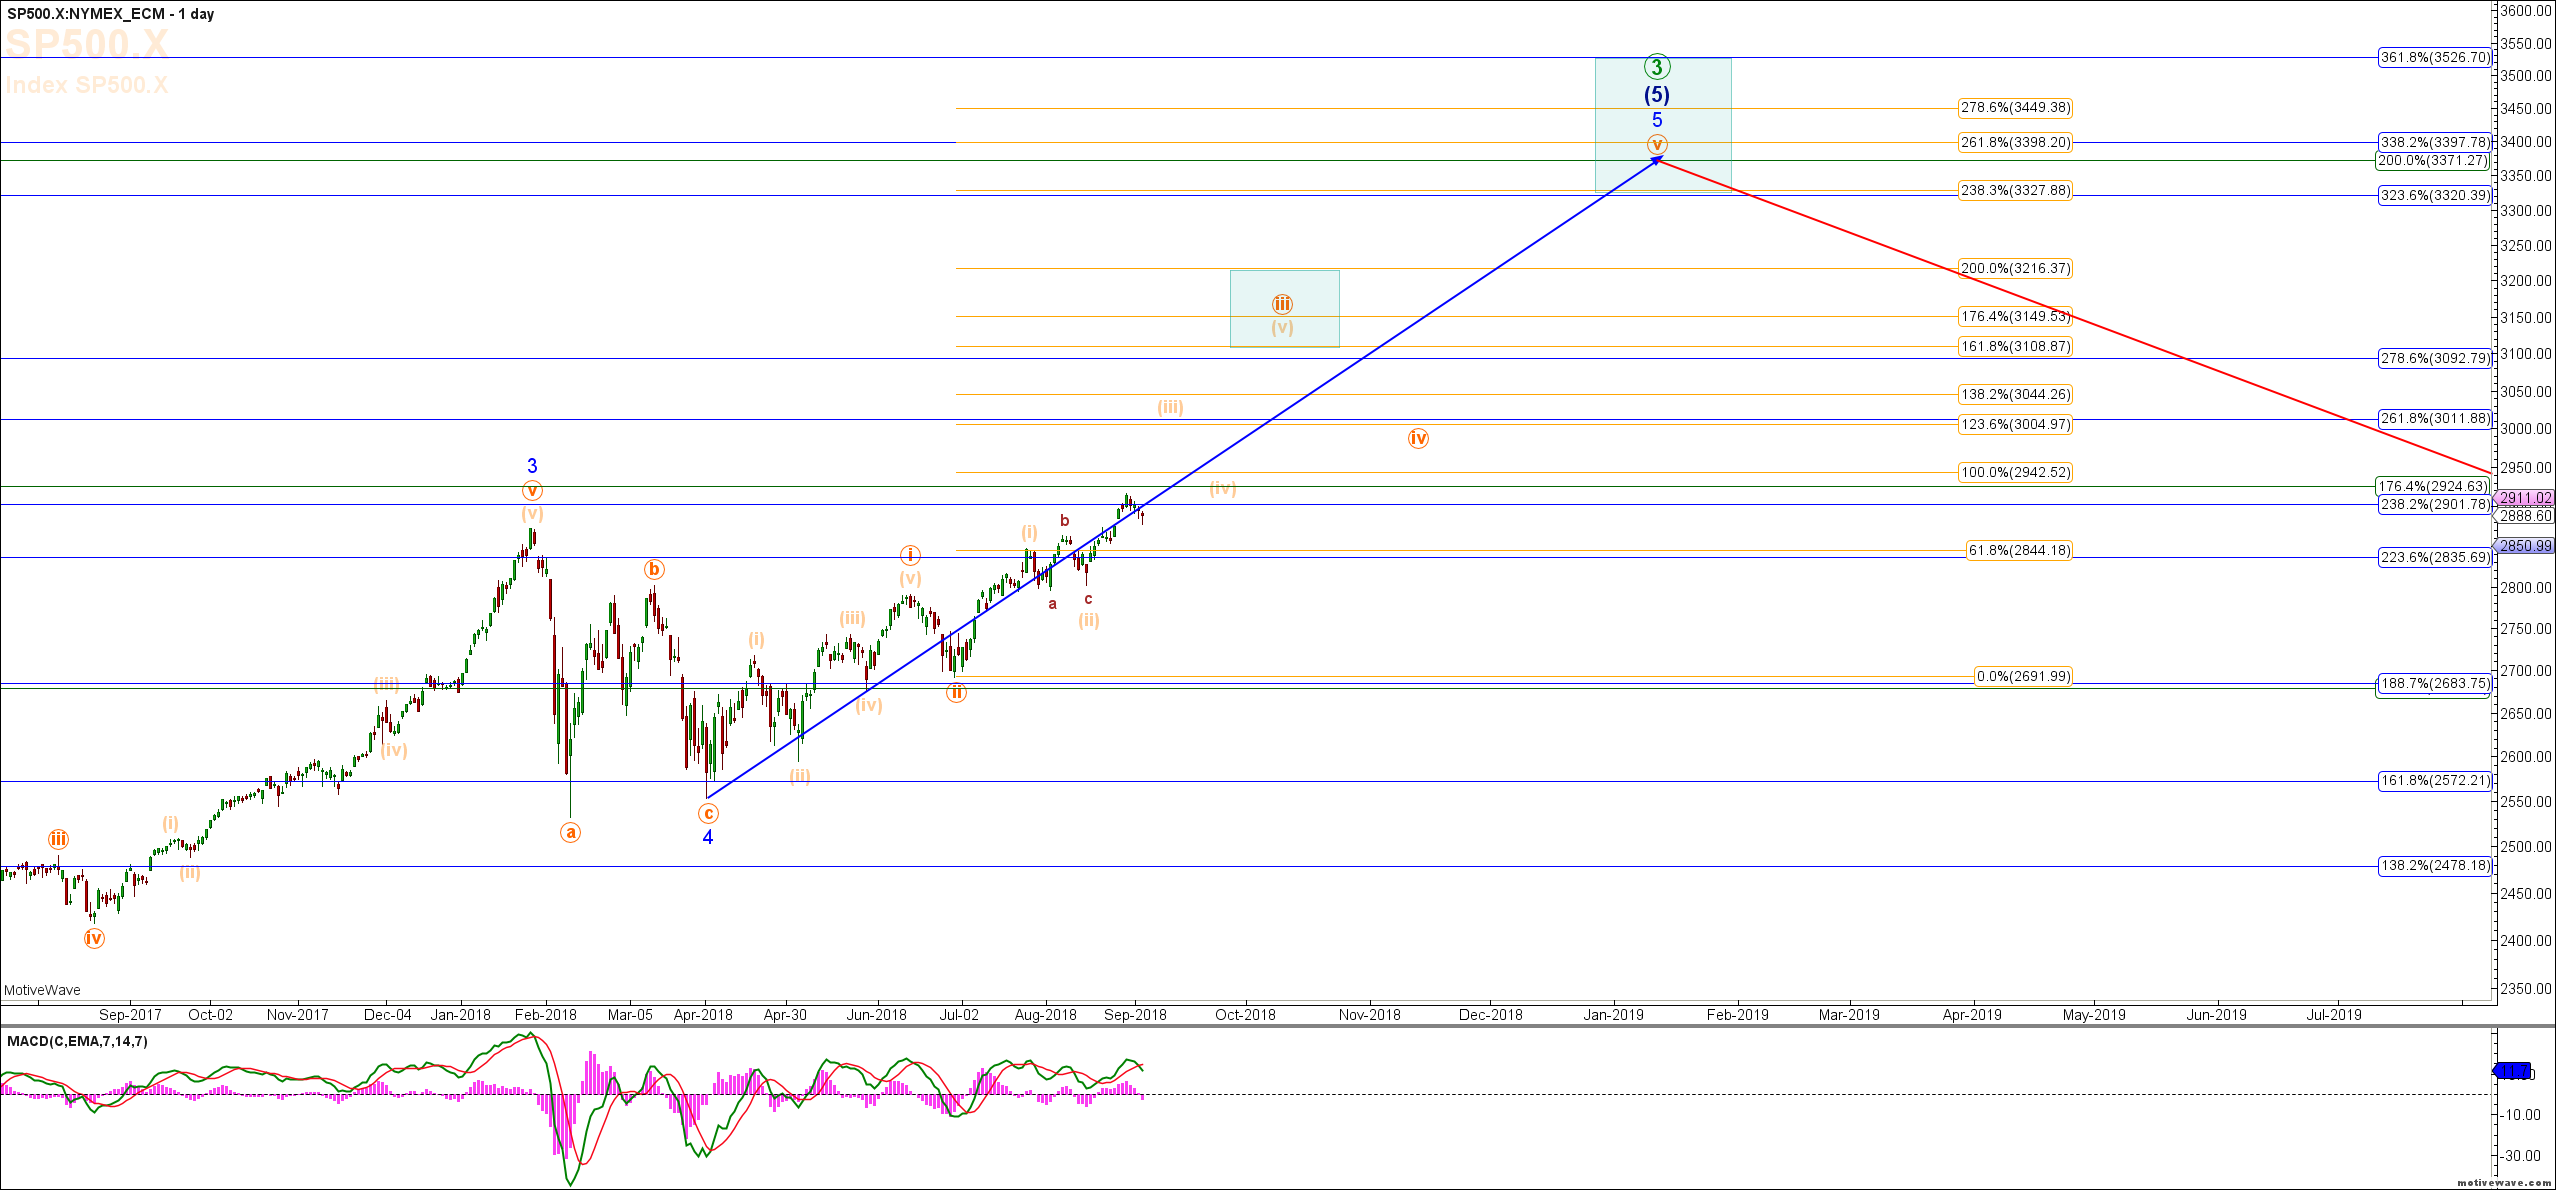
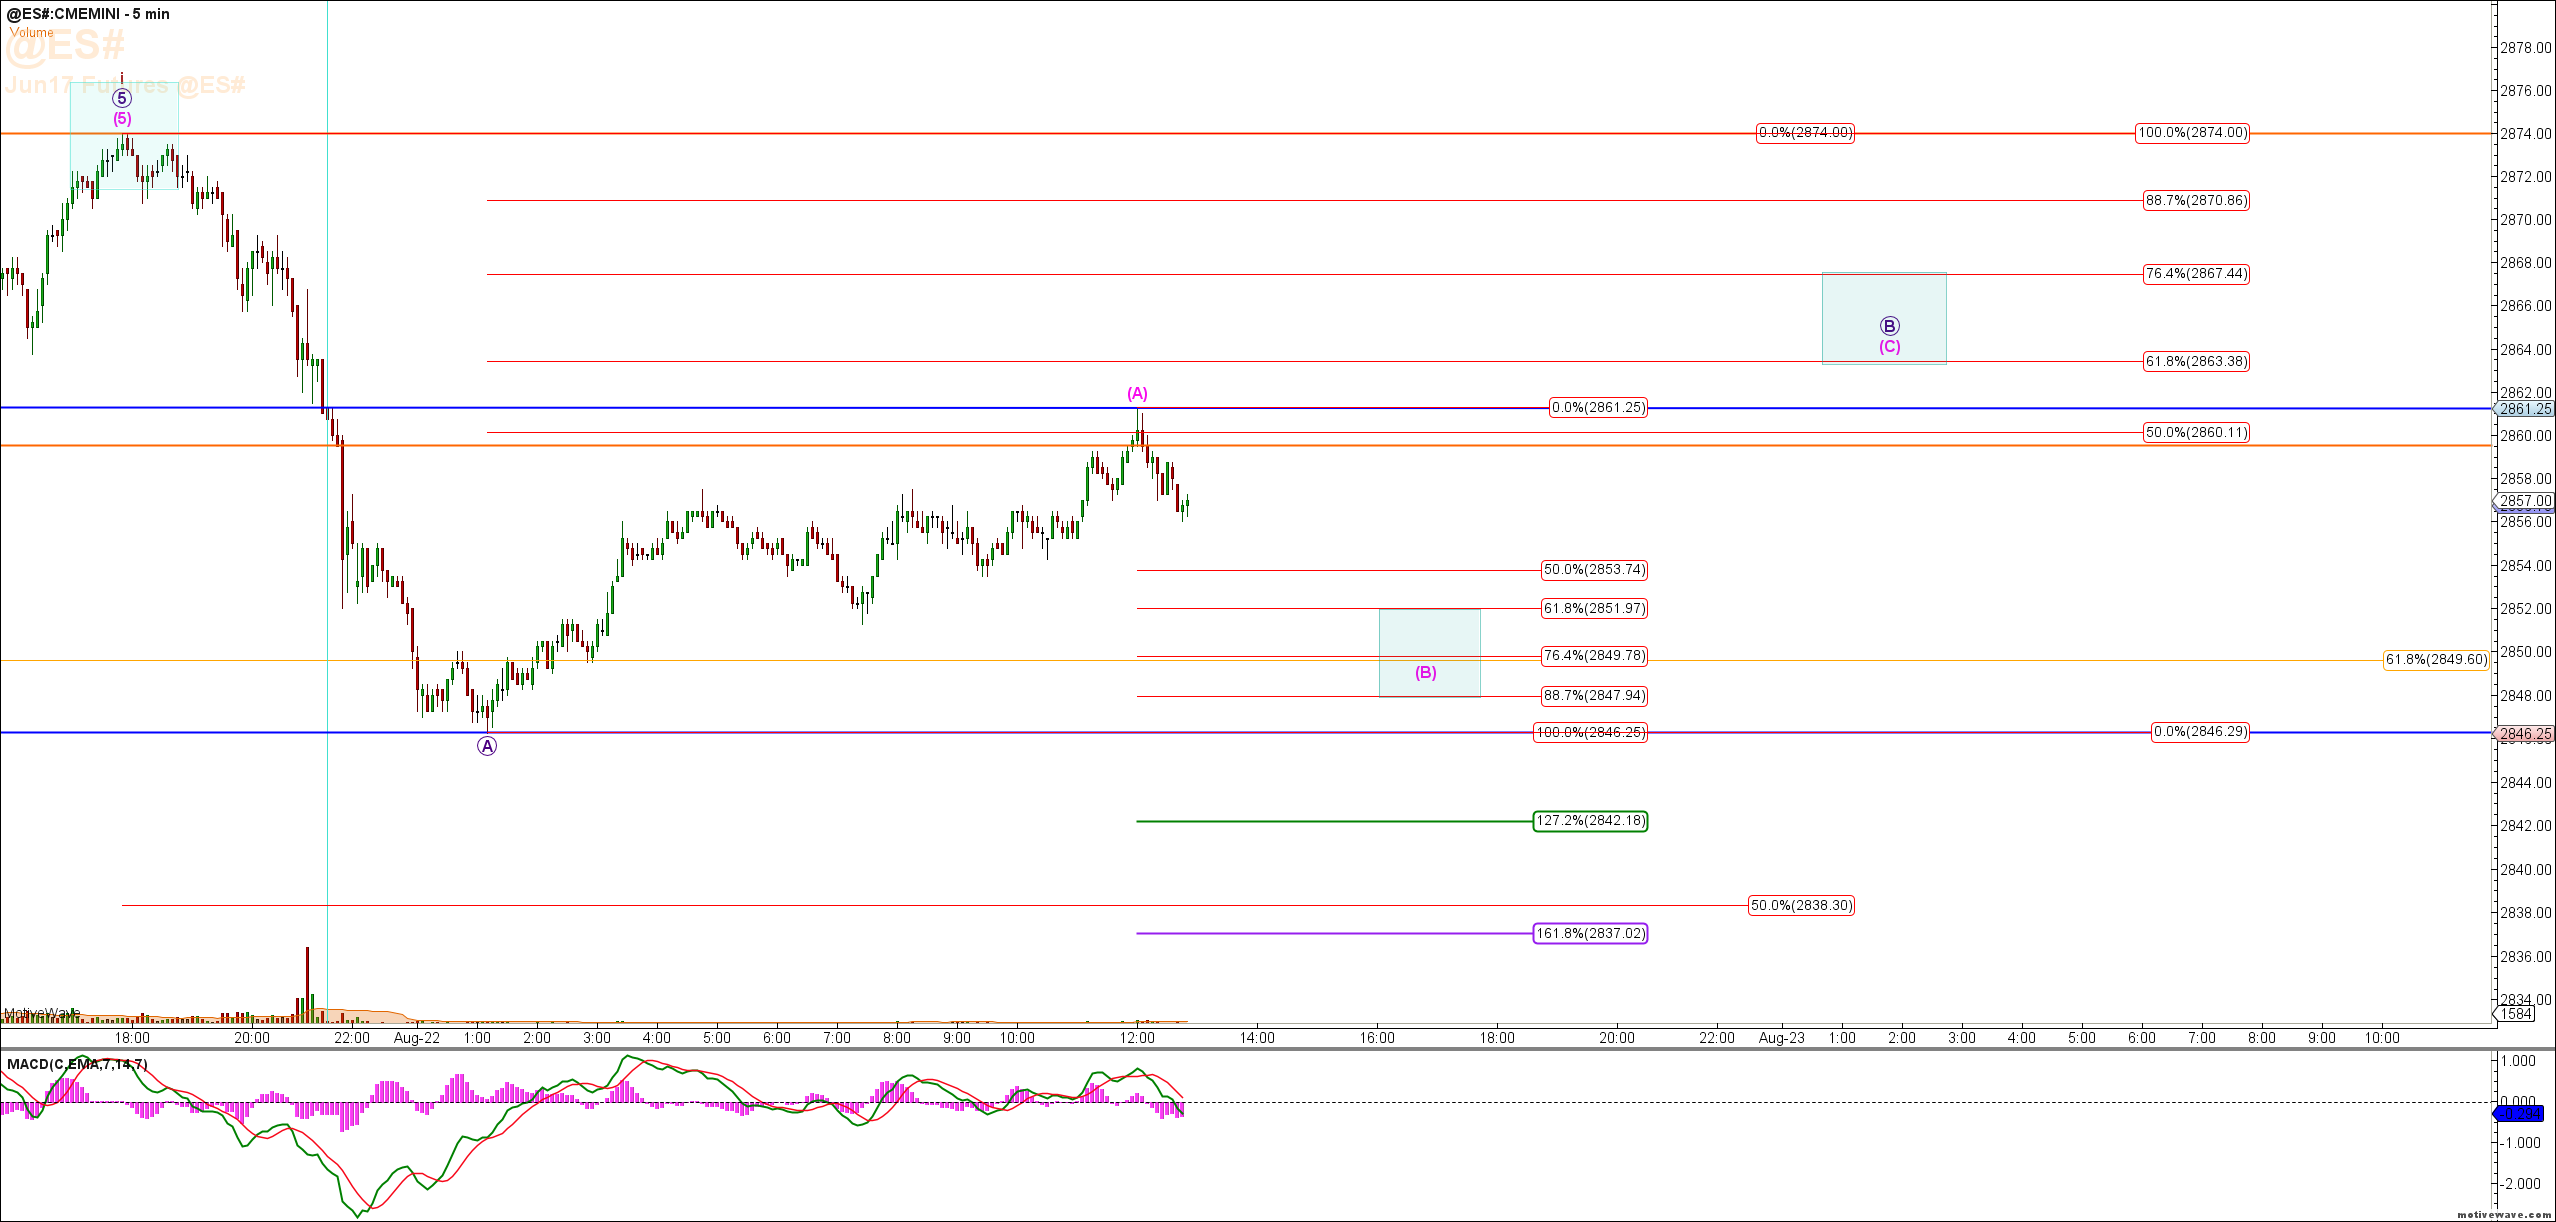
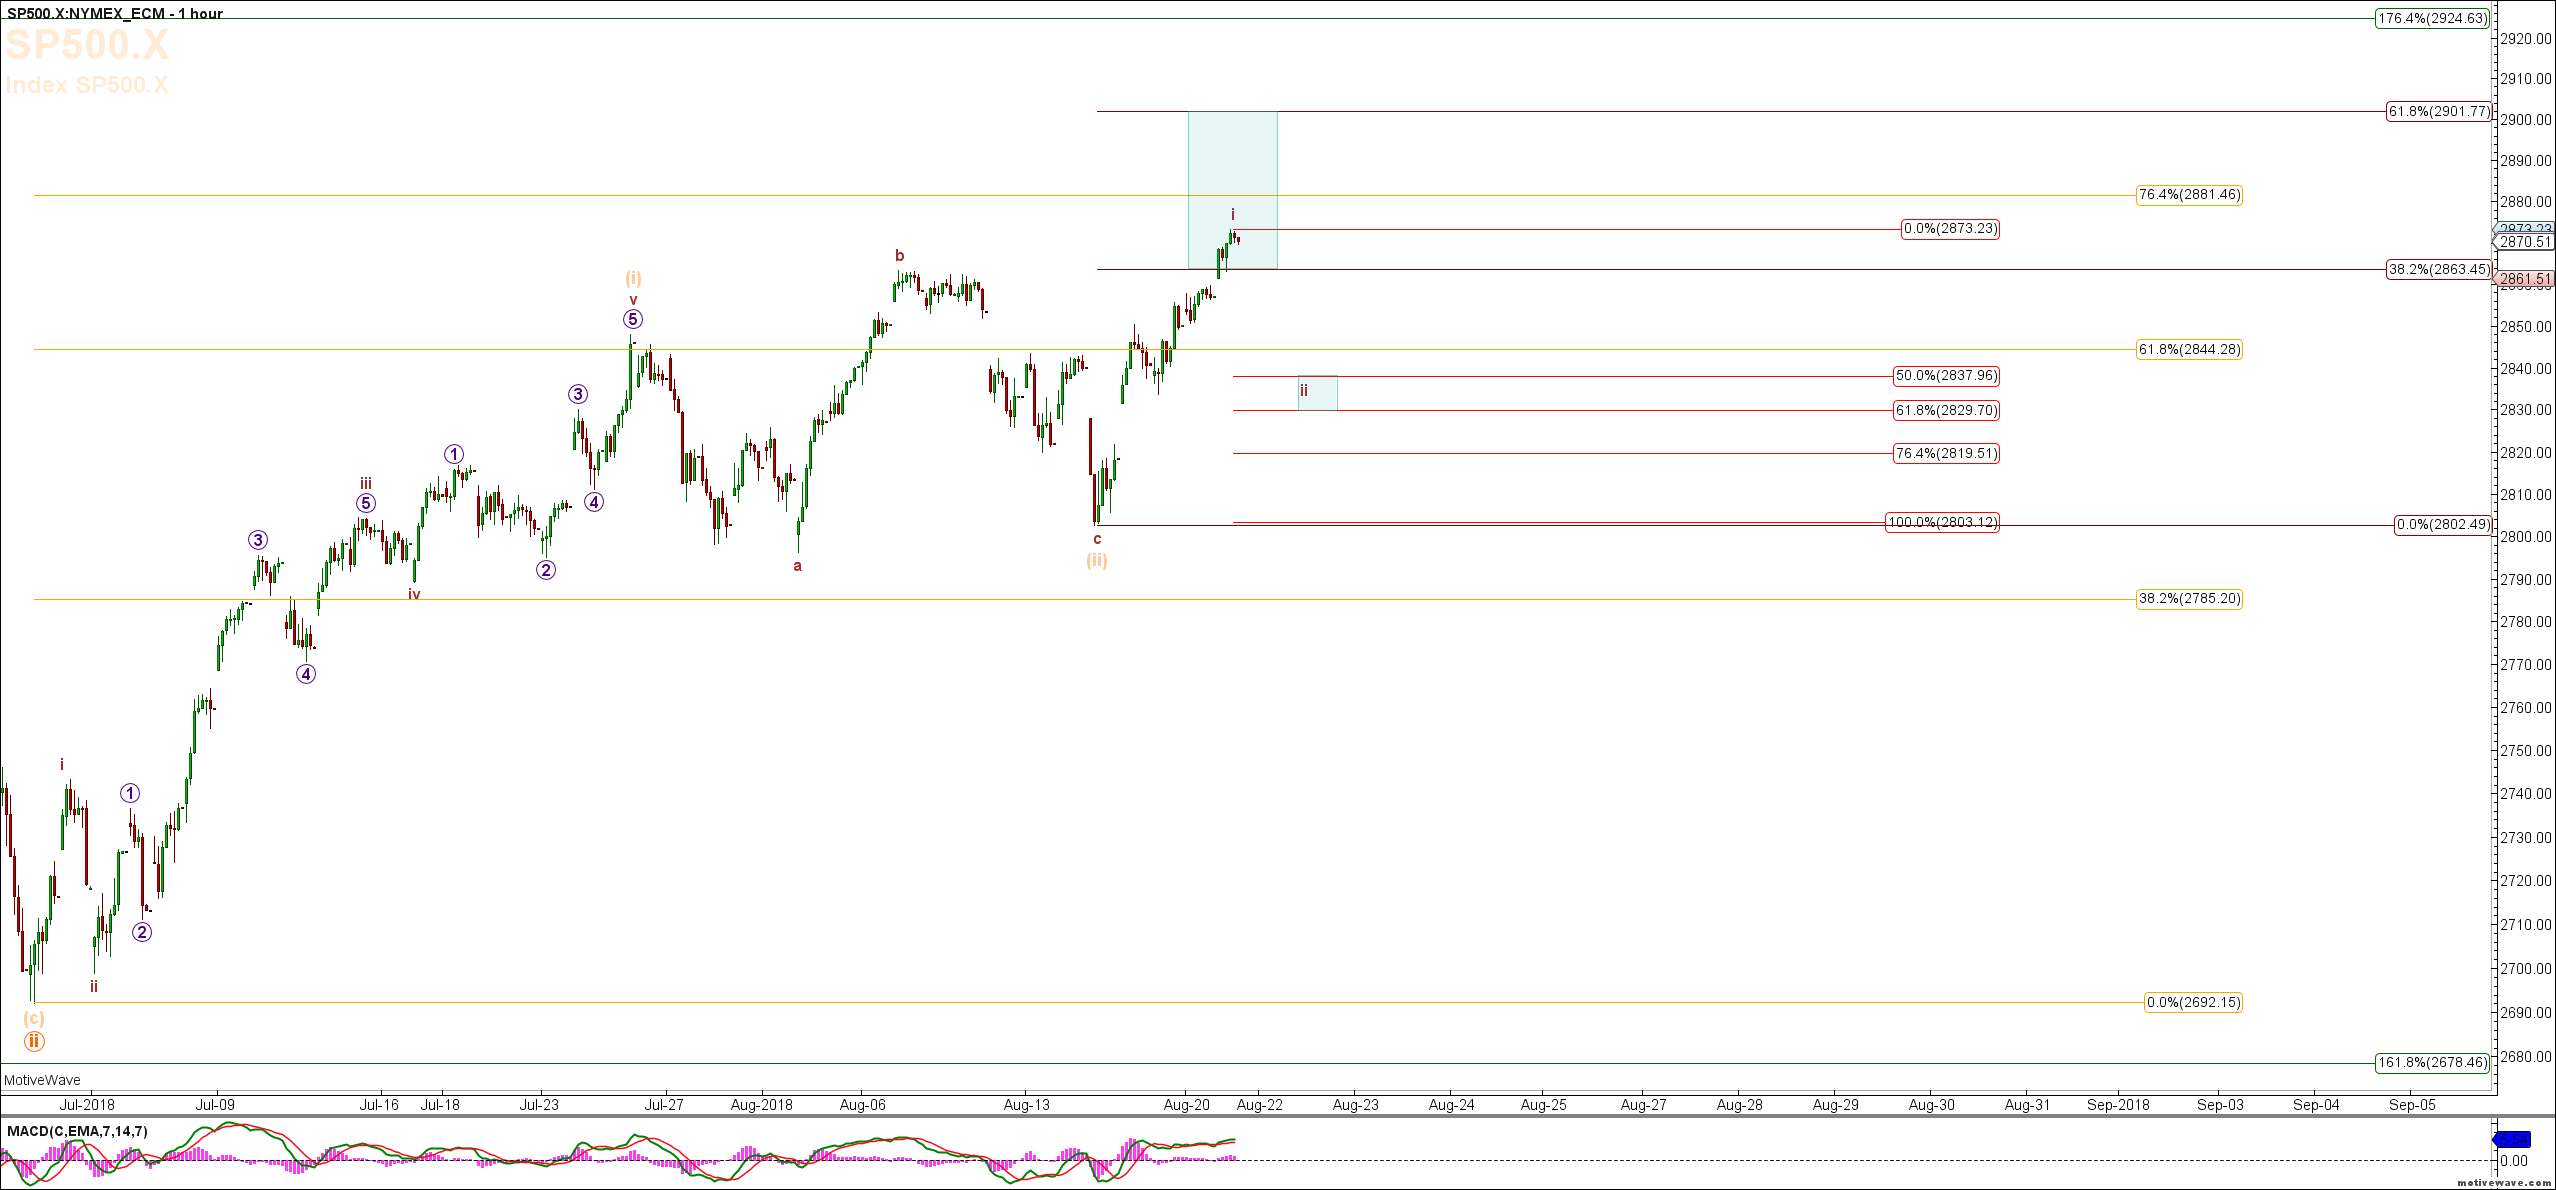
The S&P 500 Cash market has made a marginal new all time high intraday today and in doing so is now in our target zone for the completion of the wave i of iii of 3 up from the recent lows. We should now see a 3 wave correction down toward the lower target zone shown in the 15 minute chart before the next larger upside swing commences. 
Write comment Views: 1568 Comments: 0

Metals And Miners: The Wolf Is Close This Time

Brian Fletcher on 21/08/2018 2068 days ago

Summary

Buy zones for Gold, GDX, and HUI and the importance of patience.

Technical indicators match up perfectly with fundamentals for individual mining stocks.

Big upside vs. really big upside – from the standpoint of going long, does it matter right now?

Strategy for positioning capital for the next leg up.

Seabridge Gold's technical and fundamental aspects afford enormous upside potential.

This will be the first in a series of 3 articles over the next 3 weeks. In this article I’ll discuss the overall Technical buy zones and upside potential for both gold and the precious metals mining sector. In the following two articles I’ll feature the fundamental and technical analysis for 2 of the 20 miners we have narrowed down as candidates for a strategic portfolio of miners.

Write comment Views: 4820 Comments: 0

Precious Metals & Miners Update (Video)

Mike Richards on 20/08/2018 2069 days ago

Watch our Metals & Miners in-depth review of Gold, Silver, HUI, GDX & limited info regarding our Strategic Miners Portfolio on our YouTube Channel. Start your 14-day FREE trial of Time Price Analysis to see all of the details on our Strategic Miners Portfolio. 

Metals & Miners Video Review

Write comment Views: 1539 Comments: 0

Natural Gas – The Gift that Keeps on Giving

Brian Fletcher on 09/07/2018 2111 days ago

Whether you’re an active investor who manages their investment capital for exceptional performance, or a trader who seeks to generate weekly and monthly profits, natural gas is a phenomenal tool to help you to achieve your goals. 

There are a number of ways to trade in Natural Gas – ETF’s (i.e. UNG), leveraged ETF’s (i.e. DGAZ and UGAZ), and Natural Gas futures.  While we trade NG futures on a daily basis in our live trading room, our active investor subscribers are up an astonishing 38.74% thus far in 2018 in NG, resulting from only 4 individual trades lasting an average of 2 weeks each.

Write comment Views: 7214 Comments: 0

FedEx Corporation: High Confidence Technical Chart Setup

Mike Richards on 18/05/2018 2163 days ago

Brian Fletcher, one of our TPA Analysts, published an article outlining our expectations for FedEx Corporation with an entry in the $215 - $221 region and a move up to $353.

Here is an excerpt from his article and the chart for FDX:

"In simple terms, we are looking for an entry into FDX in the $215 - $221 region for a move up to $353 during the Miner degree wave 5. That’s 64% of upside during a period we expect a 28% increase in the S&P 500, and one we expect will take no more than 6 – 12 months to realize as both FDX and the S&P conclude their Intermediate Degree wave (3)."

Write comment Views: 4763 Comments: 0

“Buy” in May and Go Away – S&P 500 Targets and Timing

Mike Richards on 23/04/2018 2188 days ago

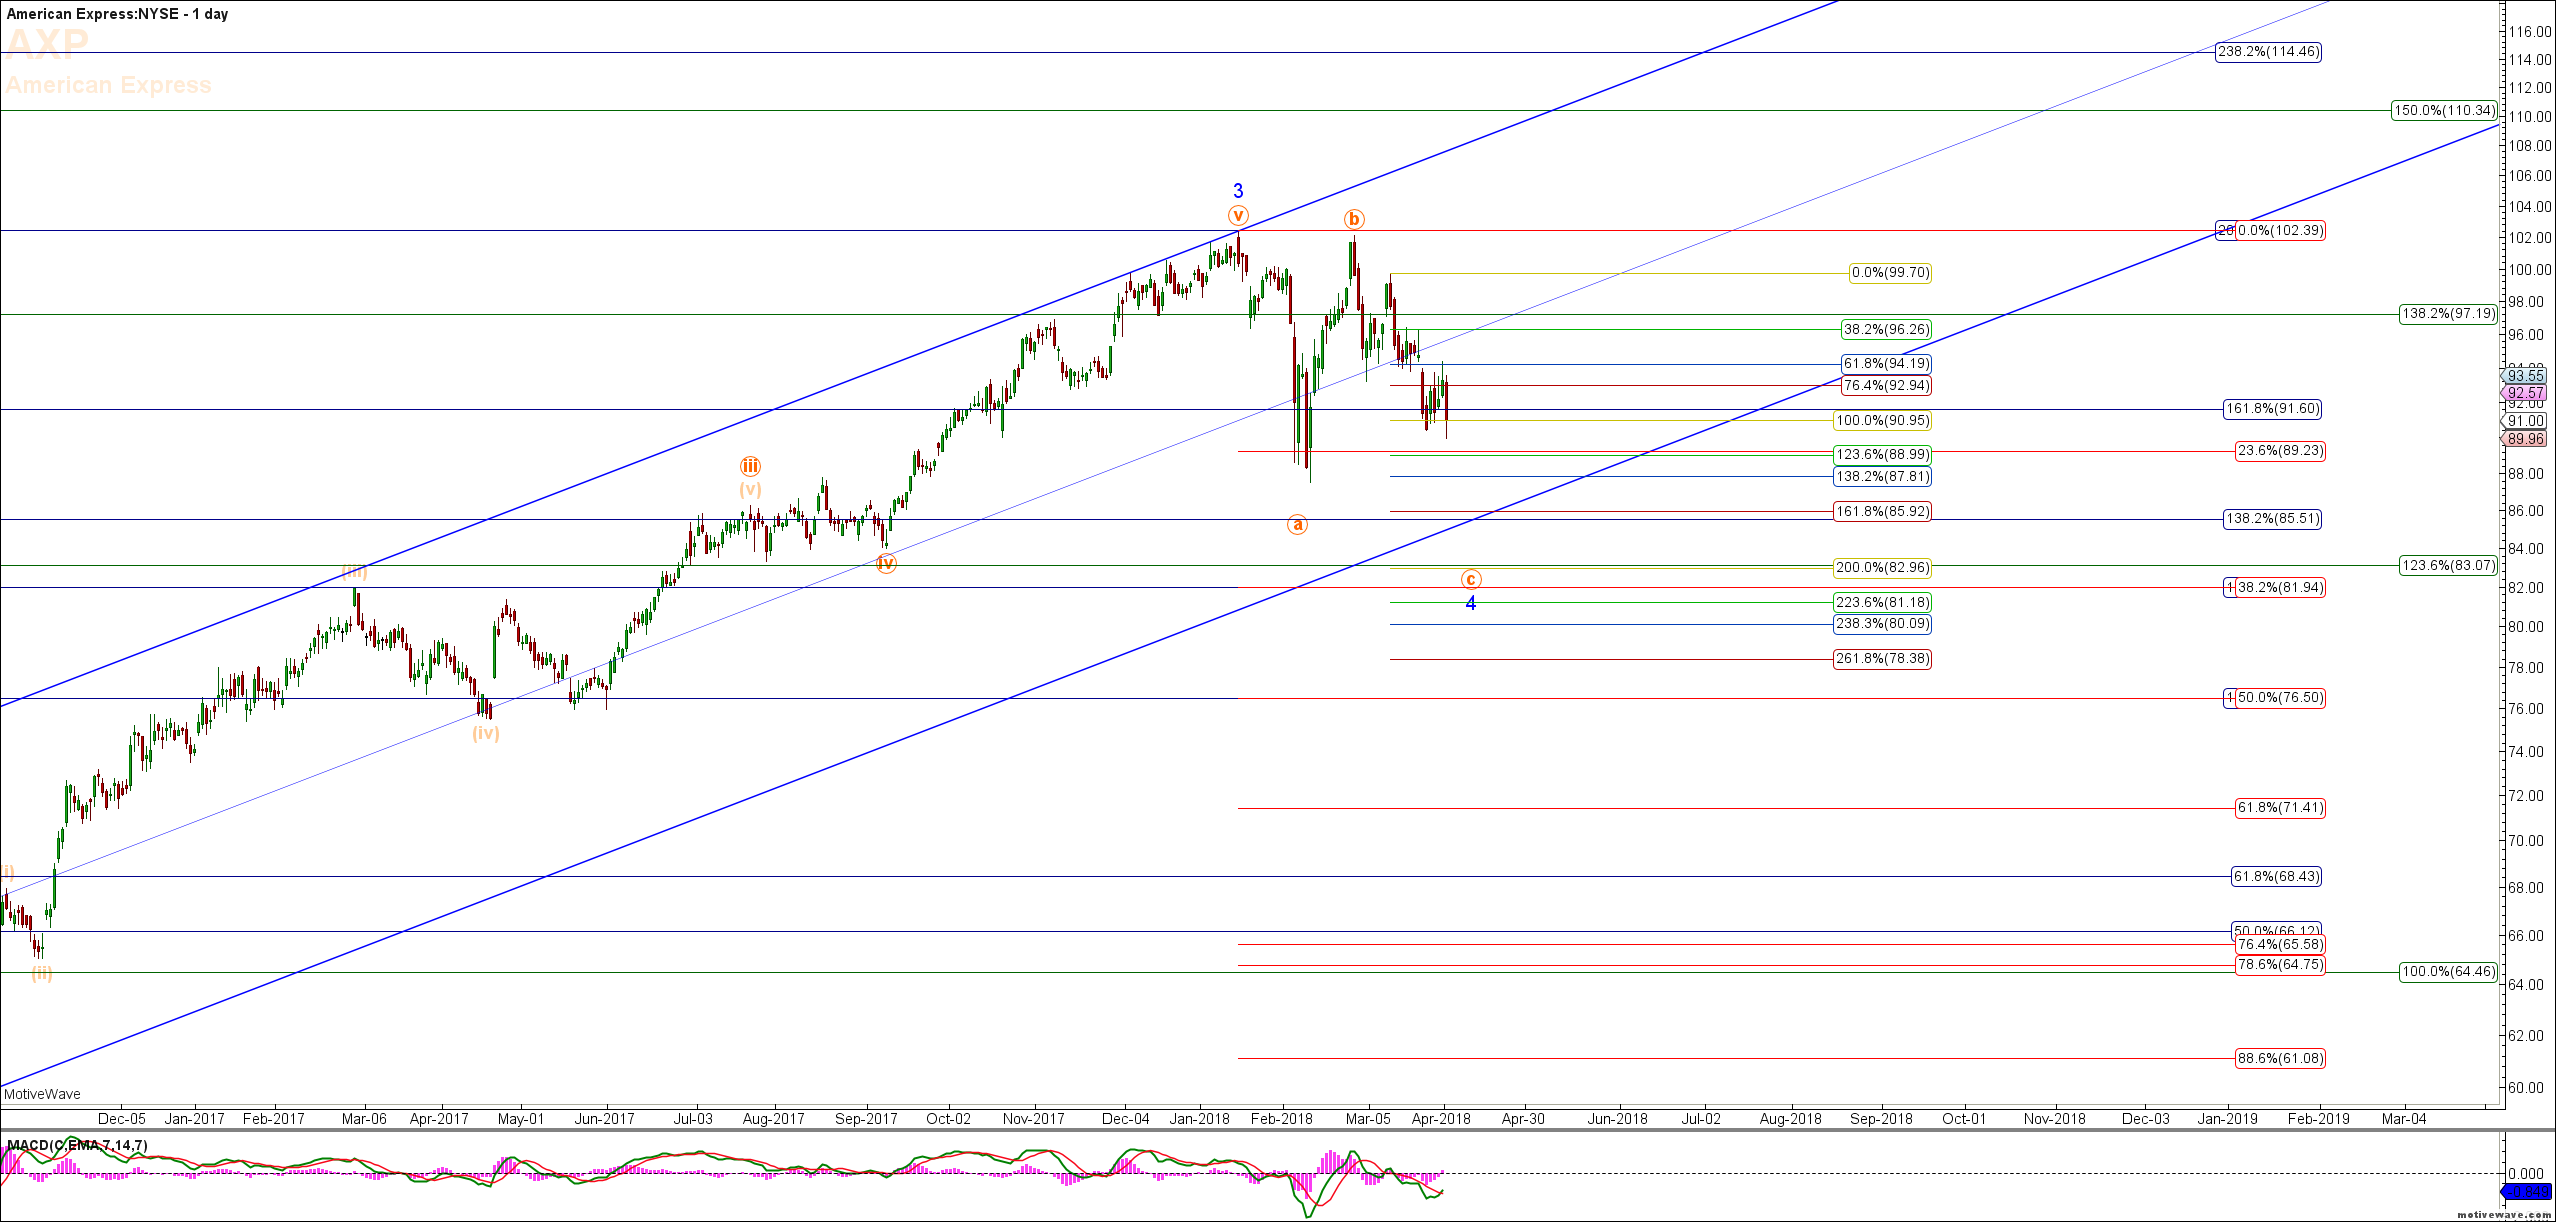
The well-known trading adage “Sell in May and Go Away” warns investors to sell equities in May to avoid seasonal declines, but not in 2018.  This year, according to our Elliott Wave and Hurst Cycles analysis, investors and traders alike should prepare a shopping list of individual stocks to go long in the coming weeks – we have!

Write comment Views: 6081 Comments: 0

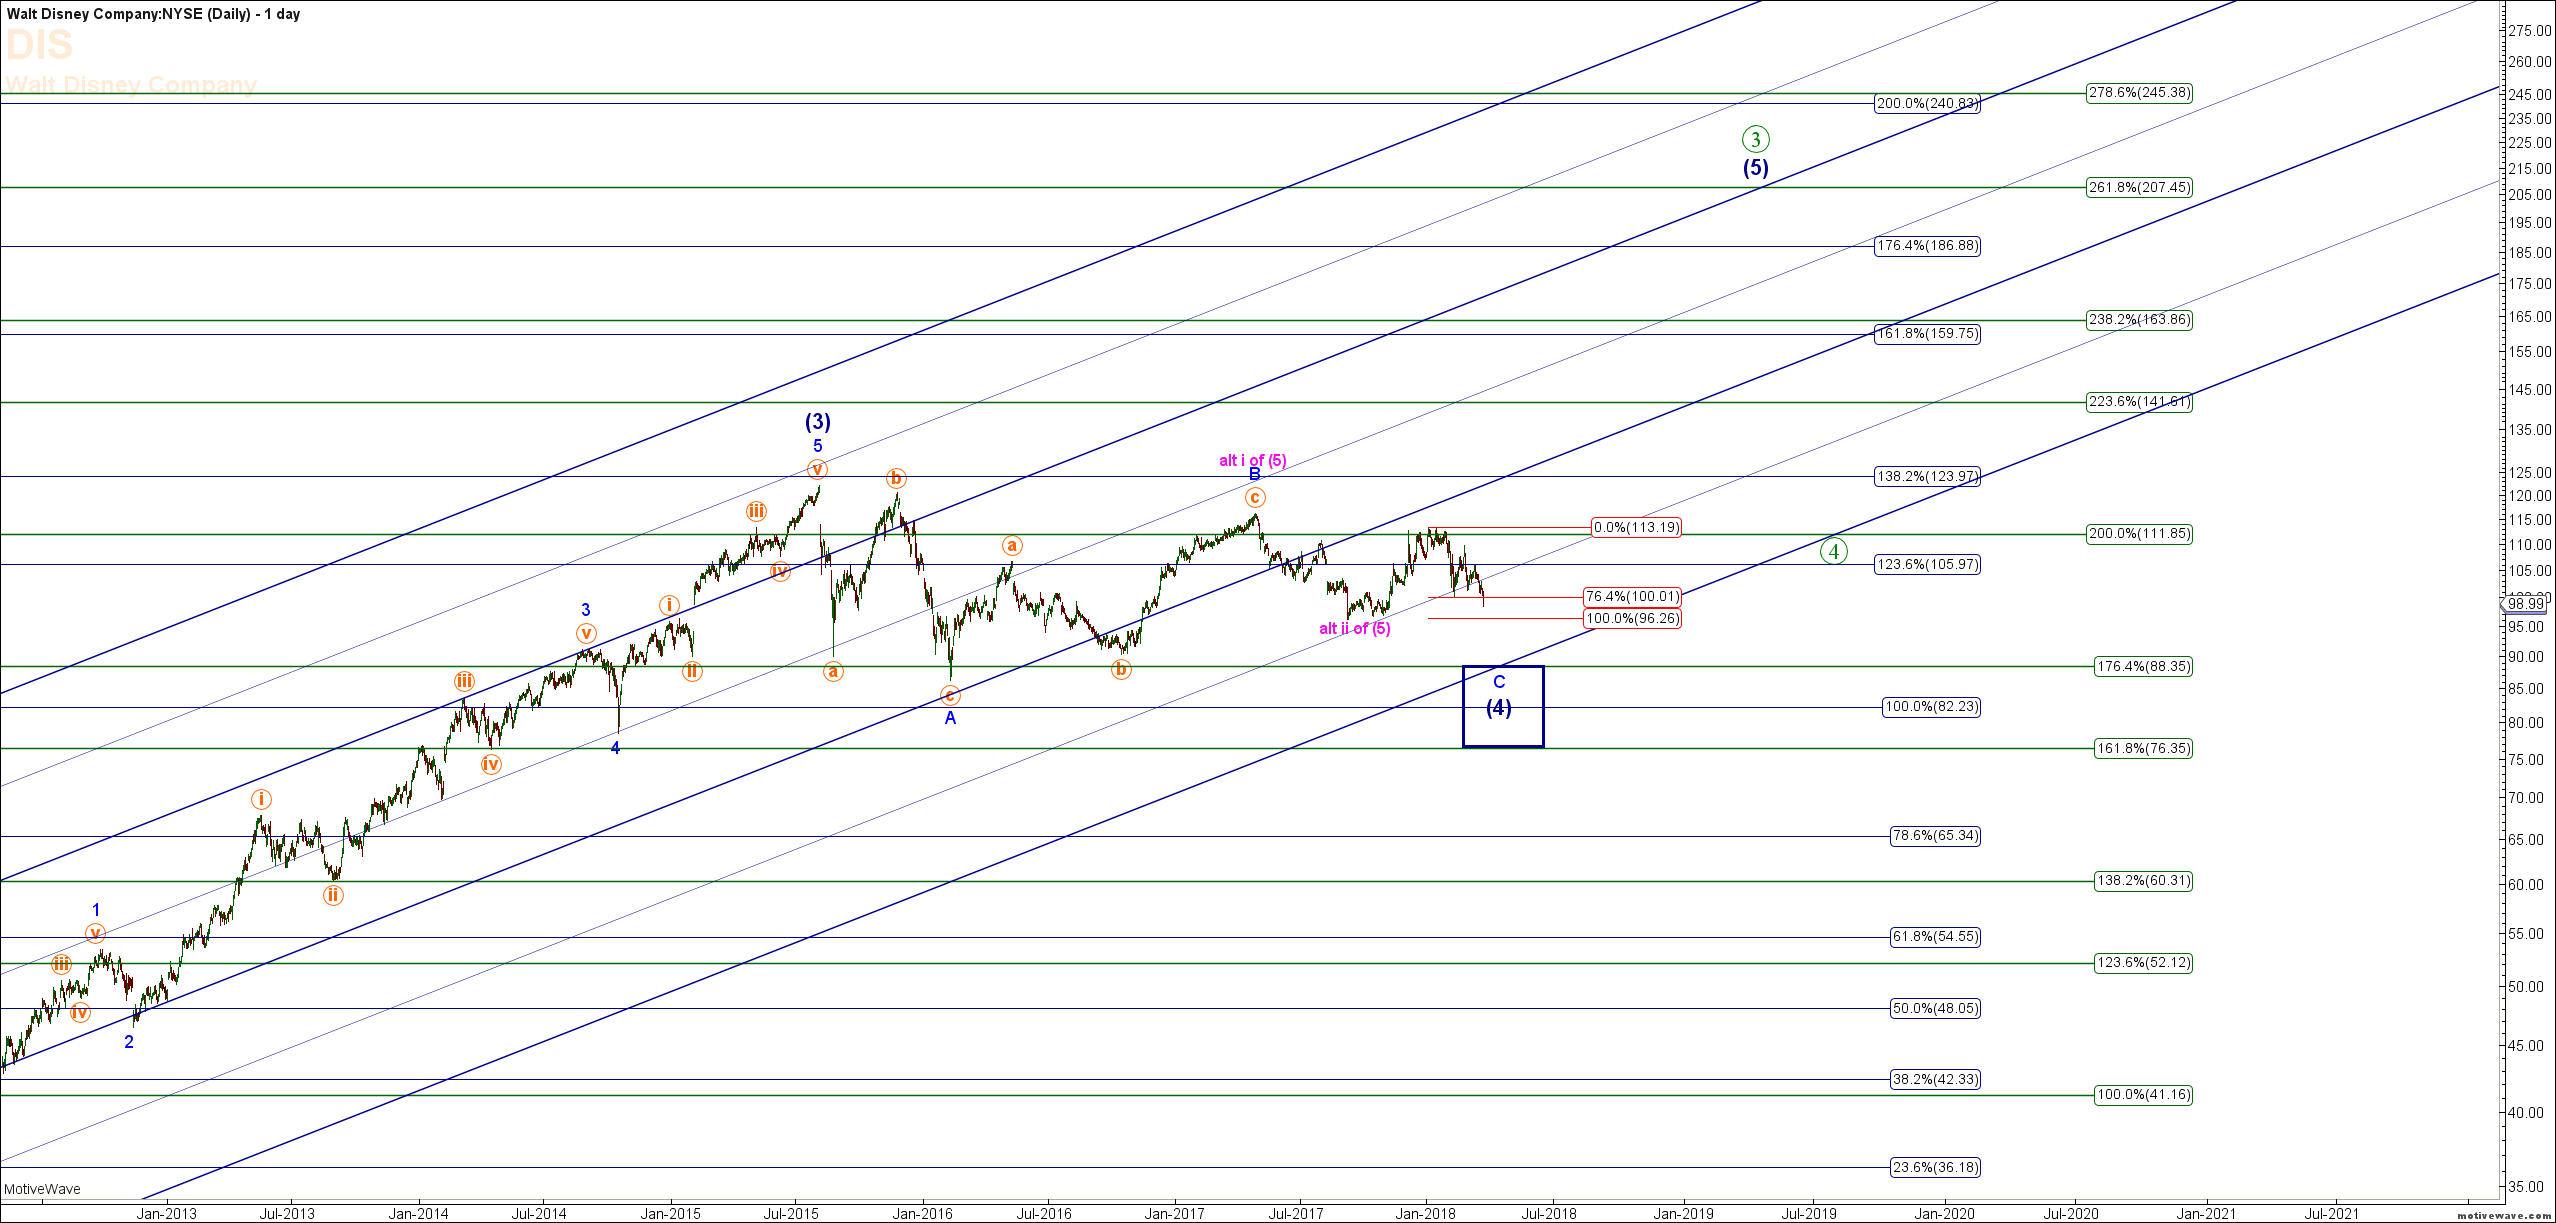
Walt Disney Company (DIS) Poised for Huge Upside

Mike Richards on 04/04/2018 2207 days ago

In my last article – (Wish List of Stocks for S&P500 Move to 3,200), I provided a small list of the many companies we have identified for our subscribers that will significantly outperform the S&P500 in its anticipated move up to the 3,200 region later this year. 

While in an era of Bitcoin and FANG stocks, Walt Disney Company (SYM:DIS) may not seem like the most glamorous stock to own, insomuch making huge profits are glamorous, Disney way more than qualifies, and given the right entry into the stock, affords investors a rare opportunity indeed.

Write comment Views: 4879 Comments: 0

Stock Watch

Mike Richards on 03/04/2018 2208 days ago

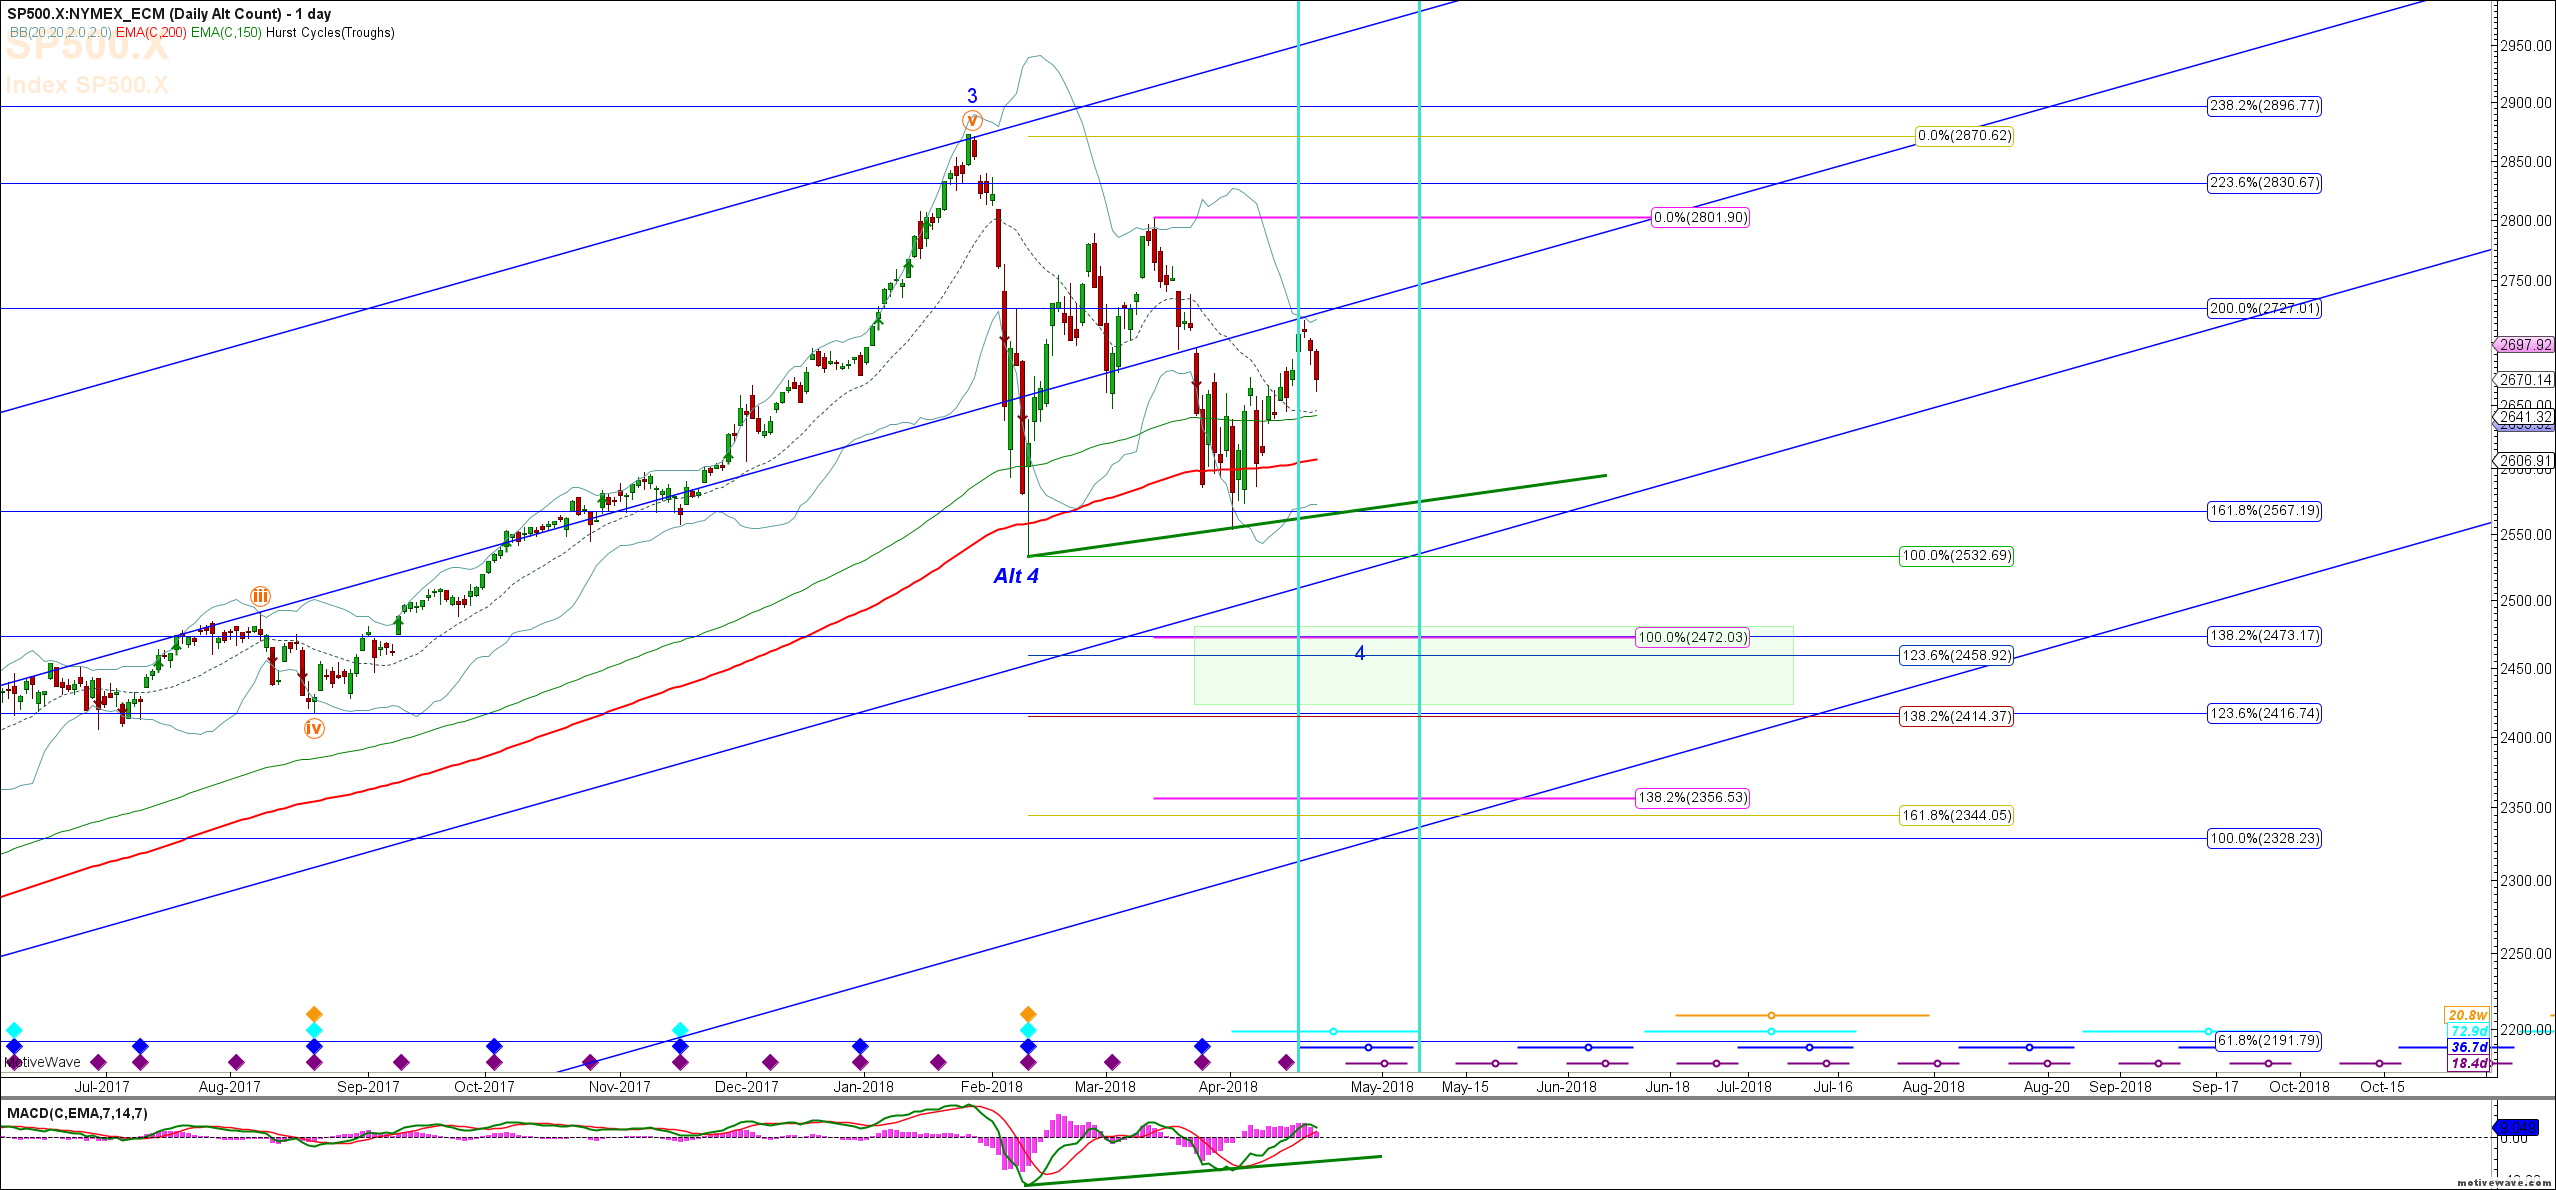
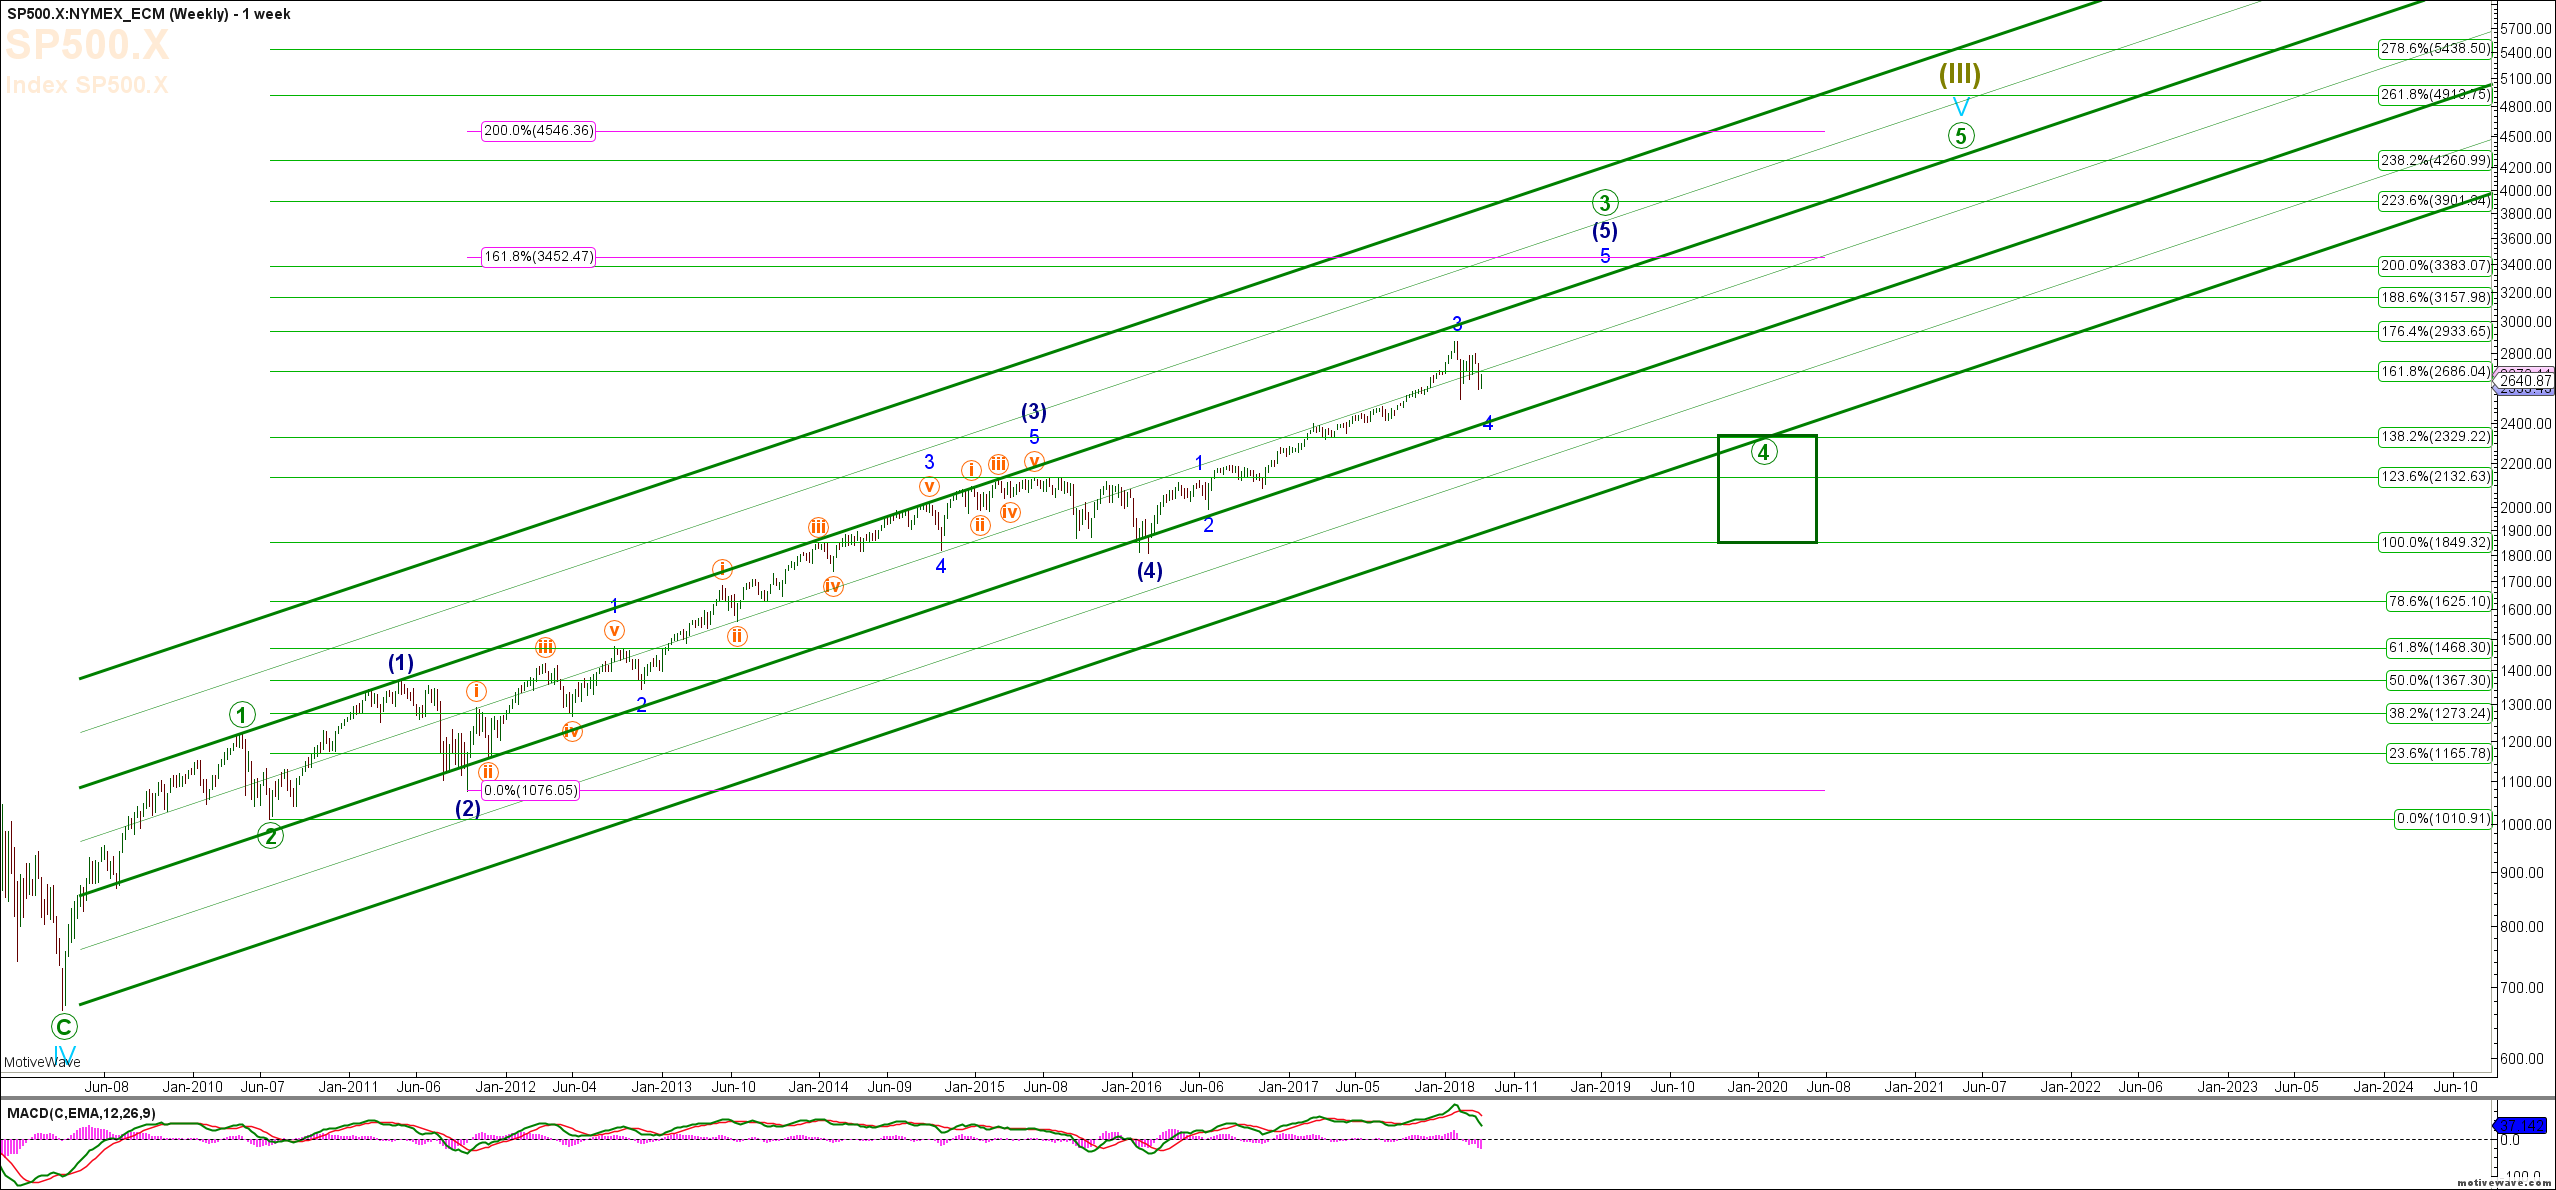
In my last article – (S&P500 – Don’t Believe the Doom and Gloom – YET!), I summarized in detail my expectations for this miner degree 4th wave corrective move in the S&P 500 Index to the 2470 – 2430 area, with an outside chance it could reach as low as the 2333 area.  I suggested the next move higher into the November, 2018 time frame should provide for an approximate 30% increase in the S&P500, resulting in a move to the region of 3,200 – 3,300.

Write comment Views: 1749 Comments: 0

S&P500 Still Has Higher To Go

Mike Richards on 02/04/2018 2209 days ago

As I read through various articles over the weekend, there is a certain doom and gloom crowd starting to resurface.   As is true in every bull markets, bears continue to cry “wolf” so many times that investor’s become complacent from their inaccuracy, only to miss the opportunity to exit equities near a meaningful high.  By combining both our Elliott Wave and Hurst Timing analysis, the time to cry “wolf” isn’t now, but will most likely occur later this year in the November timeframe, at which time our expectation of an 18-month correction that will then set the platter for another meaningful move higher from those corrective lows. Allow me to explain.

Write comment Views: 1668 Comments: 0

Where Next for the US Markets

Mike Richards on 24/02/2018 2246 days ago
The S&P 500 Stock Index has given us a welcome pullback in recent weeks and re introduced some polity back into the markets.
Write comment Views: 1786 Comments: 0