| Posted by Brian Fletcher on 17/07/2019 | 0 Comments |

Expectations for the price level move down in the S&P 500 through November, 2019.
Timing expectations for the initial move down.
Now is a good time to exit or hedge long exposure and consider short exposure to the S&P 500.
In this article I will discuss the overall Elliott Wave pattern for the S&P 500 and our expectations for an initial pull back into November, 2019. For those investors who wish to hedge long portfolios, exit equity exposure, or short equities through the use of ETF’s like ProShares TR/Short S&P 500 (SH) or ProShares UltraShort S&P500 (SDS), this is an excellent are to consider such an approach.
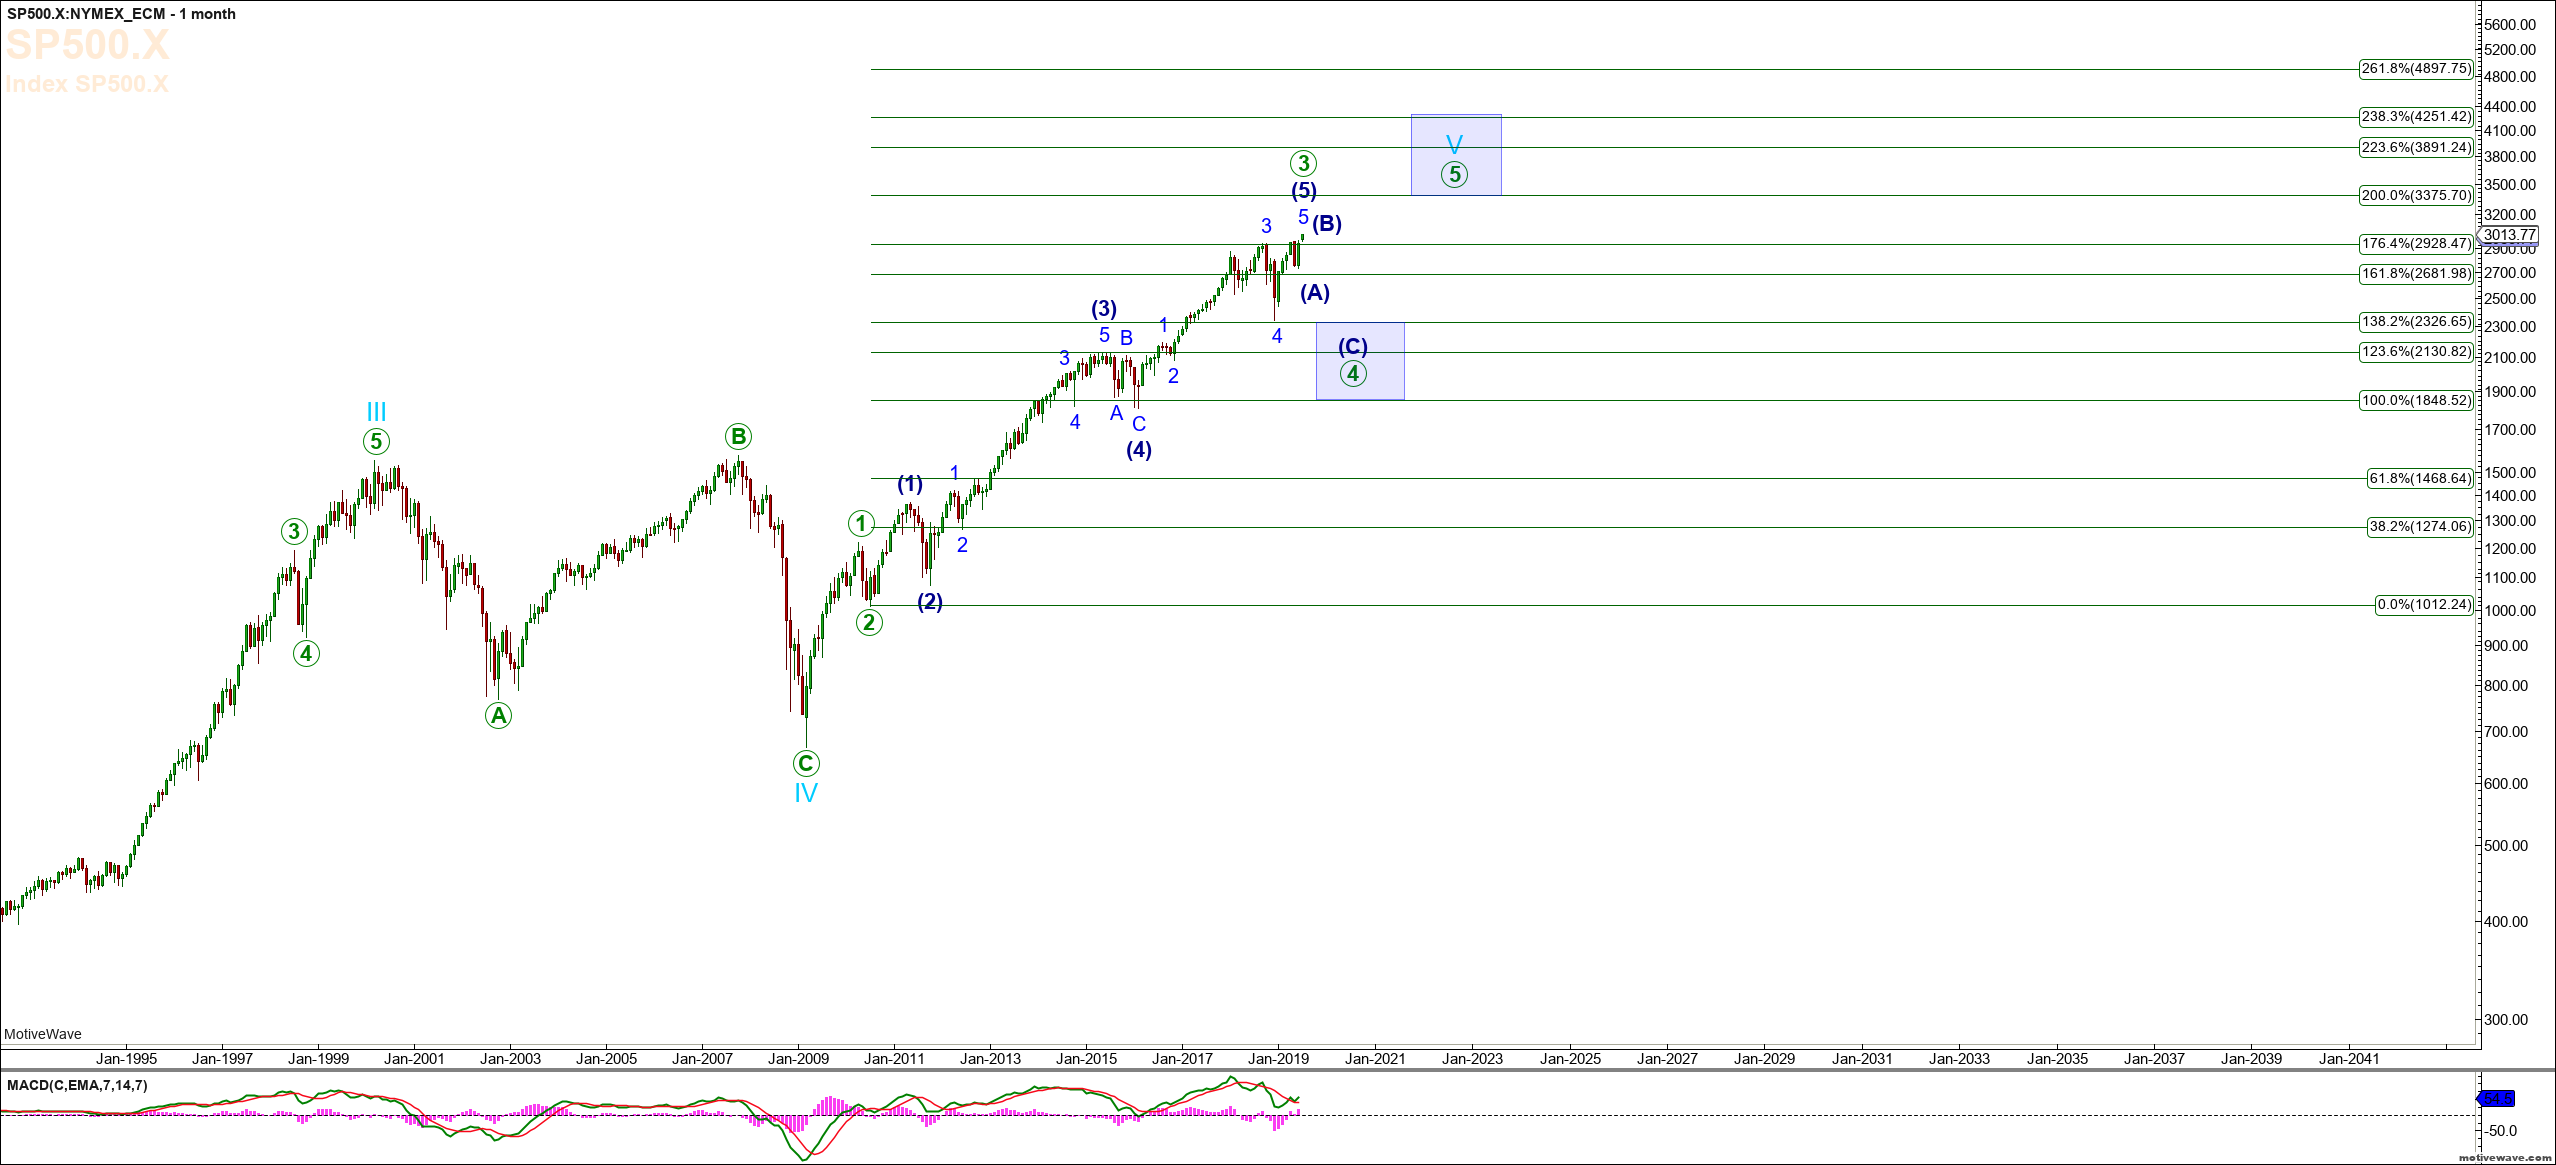
First, allow me to review a birds-eye view of the move up in the SPX from the 2009 low – See the S&P 500 Monthly Chart below. The 2009 low is what we refer to as the wave IV Cycle Degree low. This means we are currently charting the Cycle Degree wave V, with expectations of an ultimate move to 3375 – 4251. The green Fibonnaci levels represent the Primary Degree wave structure, which is one degree smaller than the Cycle Degree wave structure. Note that we would normally expect the wave (3) of the 3rd wave to hit the 1.236 extension level, which it perfectly adhered, and then wave (4) to hold the 1.0 bottom up Fibonnaci level, which it perfectly adhered to as well. The next move up would complete all of Primary Degree wave 3, shown on the monthly chart as the green wave 3, at the 1.618, 1.764, or 2.0 extension levels. Thus far we have seen the S&P hit the 1.764 extension level. This would suggest a pull back to the 1.382, 1.236, or 1.0 bottom up Fibonnaci extension levels. In other words a pull back to 2326, 2130, or 1848.
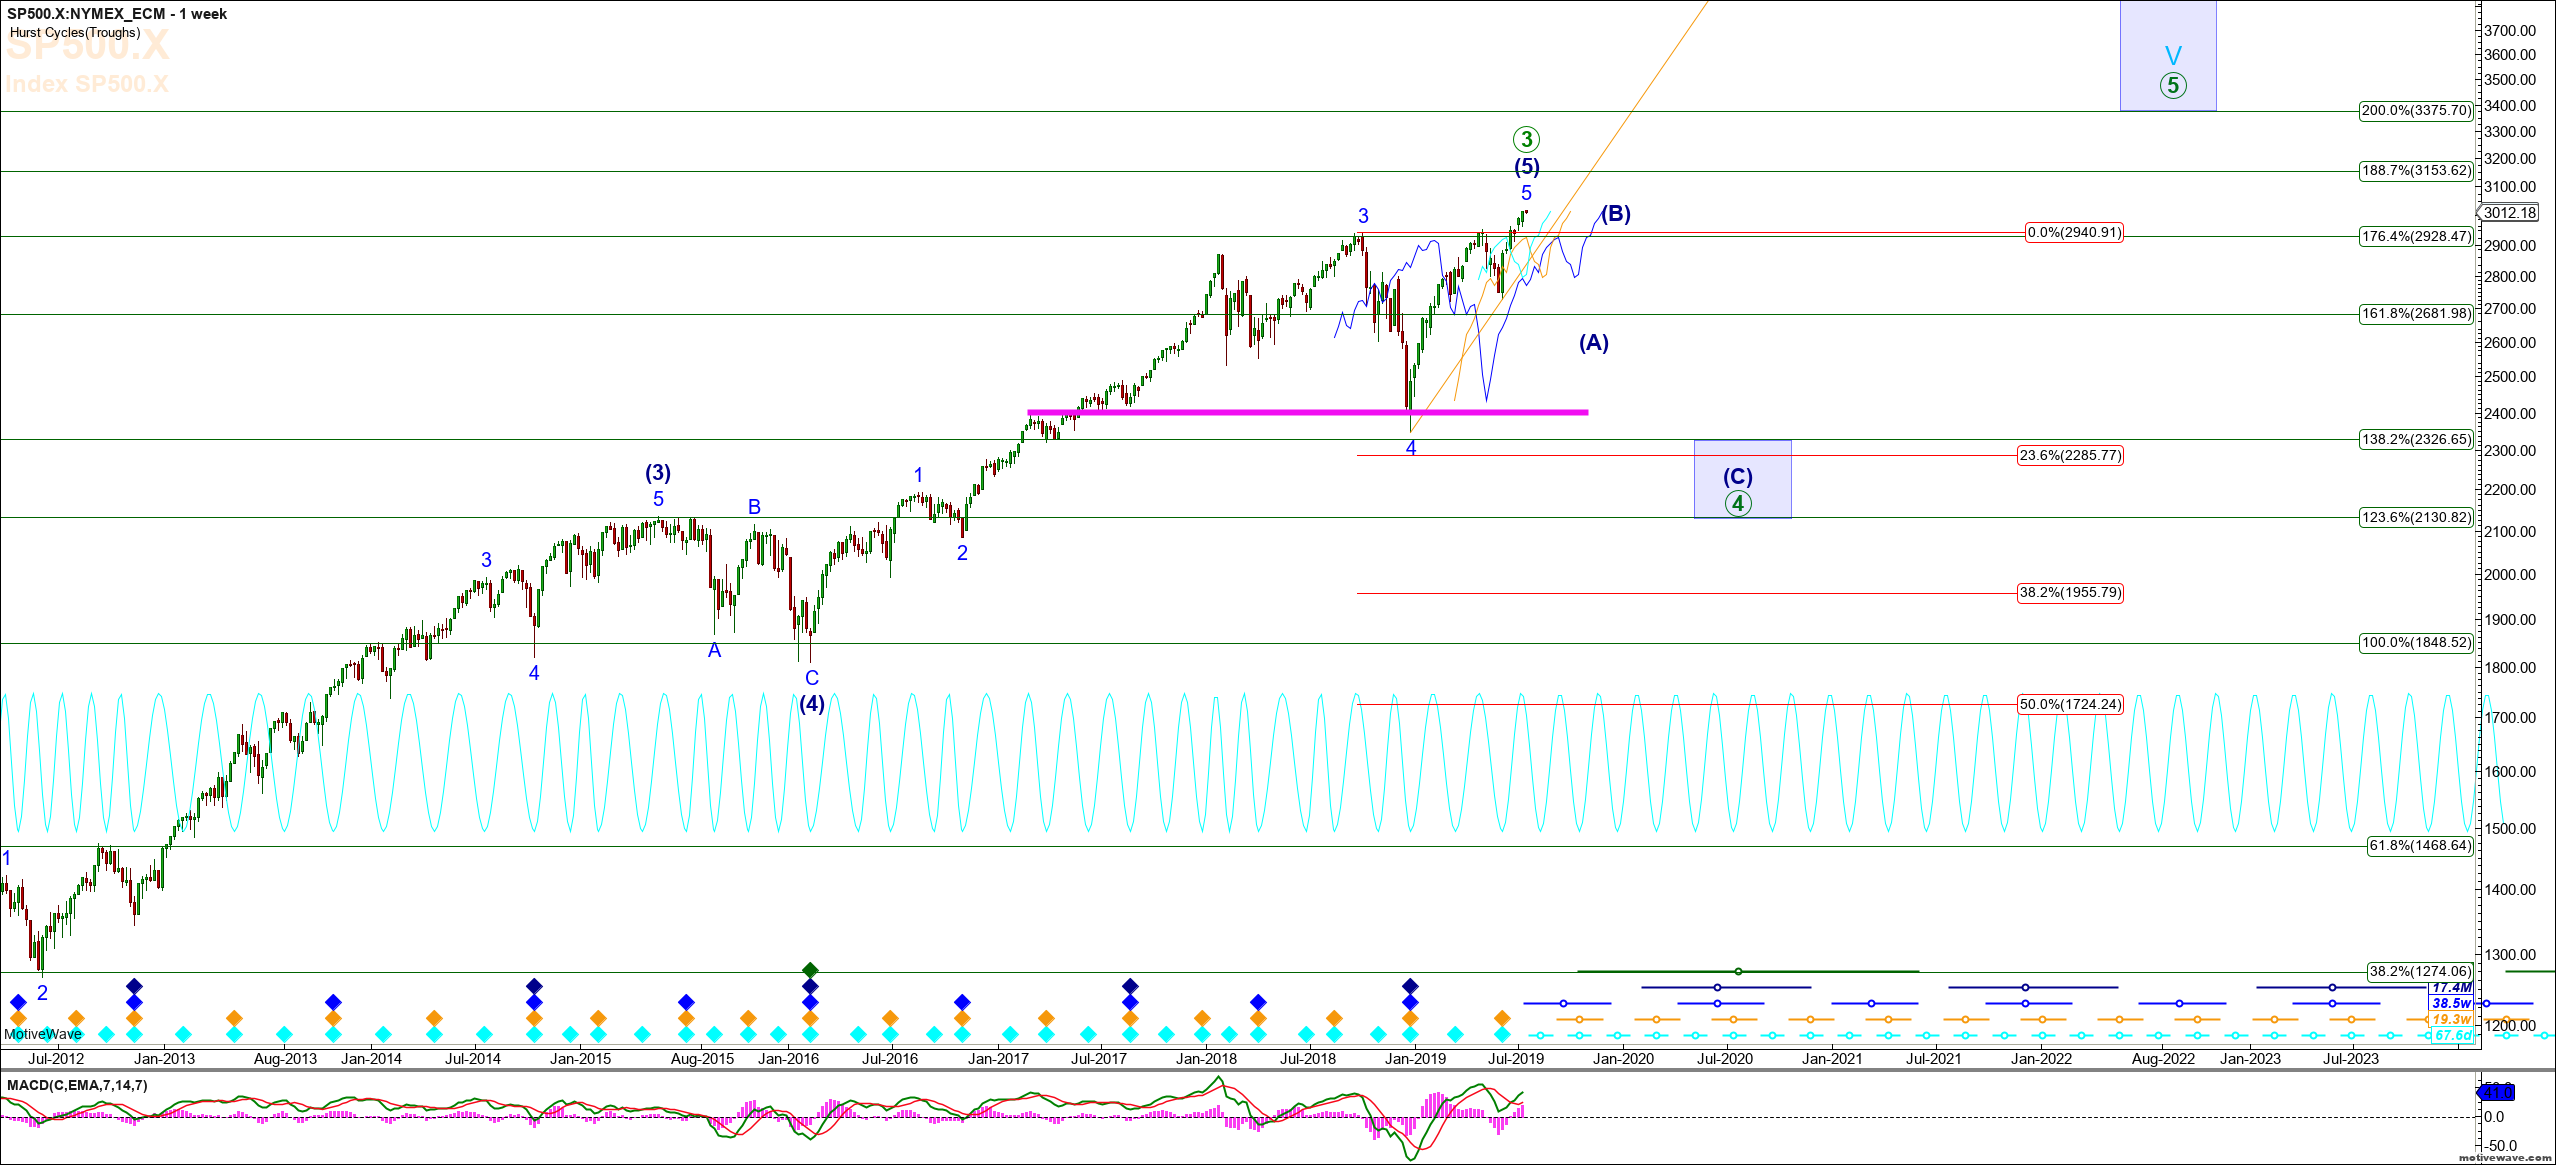
 Now, let us turn our attention to the S&P 500 Weekly Chart below. Our expectation is that the S&P 500 will turn down between current levels and 3090 to commence the downside of Primary Degree Wave 4. Our Hurst Cycle Timing analysis suggests the most probable range of time to turn down is between July 16th and July 20th. The move down will take the form of an ABC structure, where the most likely price level targets are 2326 – 2130.
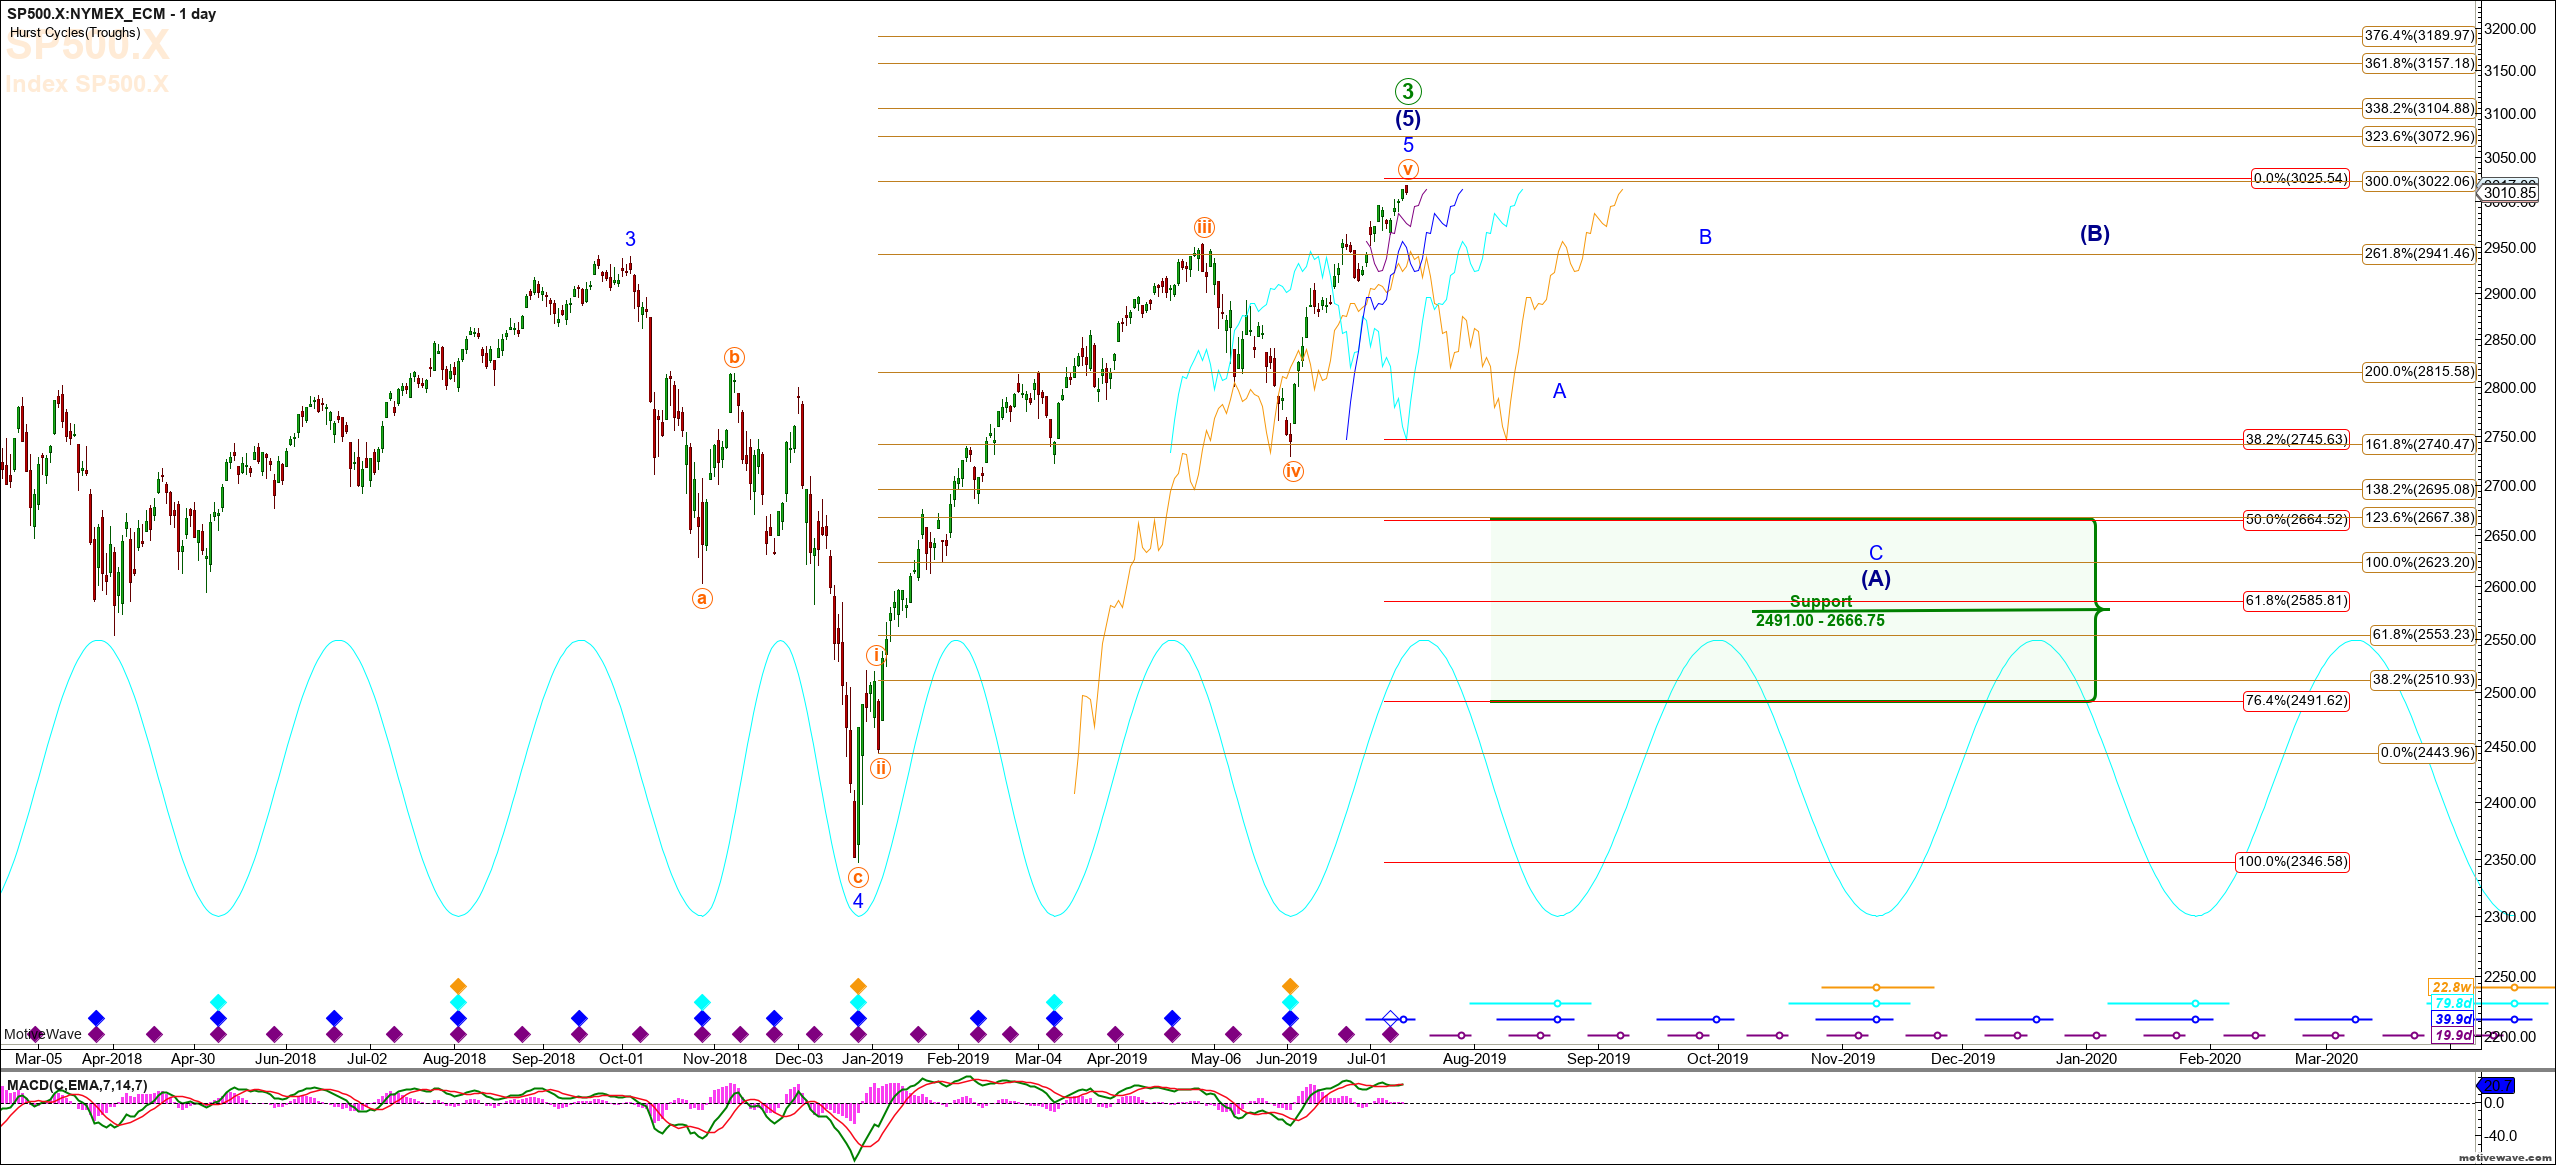
 Now, let us turn out attention to the S&P 500 Daily Chart below. We would anticipate that the initial (A) wave down will take the form of an ABC structure as well. This wave structure is the Intermediate Degree move down. In terms of the Hurst Timing Cycles, we are expecting a move down to the SPX 2750 – 2800 region by August 20th – 31st that could be viewed as an a-wave of A wave of (A), then a bounce into September 28th as a B wave of (A) which is then followed by a C wave of (A) into the SPX 2585 into early November. This is collectively a 15% drop from current levels. This would complete all of wave (A) into early November and result in a large bounce, noted as the (B) wave into early 2020. All of the correction would not complete until late spring to early summer 2020.
Note also that IF Primary Degree Wave 4 is already complete, that we think odds favor it is not complete, the ABC structure down into the early November time frame approximates the .618 retrace of the entire move up off the 2018 Christmas Eve low. In the event that our analysis is off, and the move up off the low established in late 2018 was the initial 5 wave structure of Primary Degree Wave 5, then this area will be an opportunity to go long. Many a time in the last 10 years I’ve seen an expected B wave morph into a 3rd wave, and provided this level holds in the 2585 region, it would be a reasonable area to put on long equity exposure.
 In conclusion, we anticipate markets to have topped, or top in the coming days, followed by a move down into late August, a bounce into late September, and continuation down into early November. For those looking to hedge, exit long exposure, or short markets, this is an excellent area to do so. We have issued trade alerts to our subscribers and taken specific action to enter short exposure with defined stop out levels, and will continue to manage risk in this move down. Upon completion of this expected move down into early November, it could setup a nice long entry opportunity as well.