| Posted by Brian Fletcher on 03/04/2019 | 0 Comments |
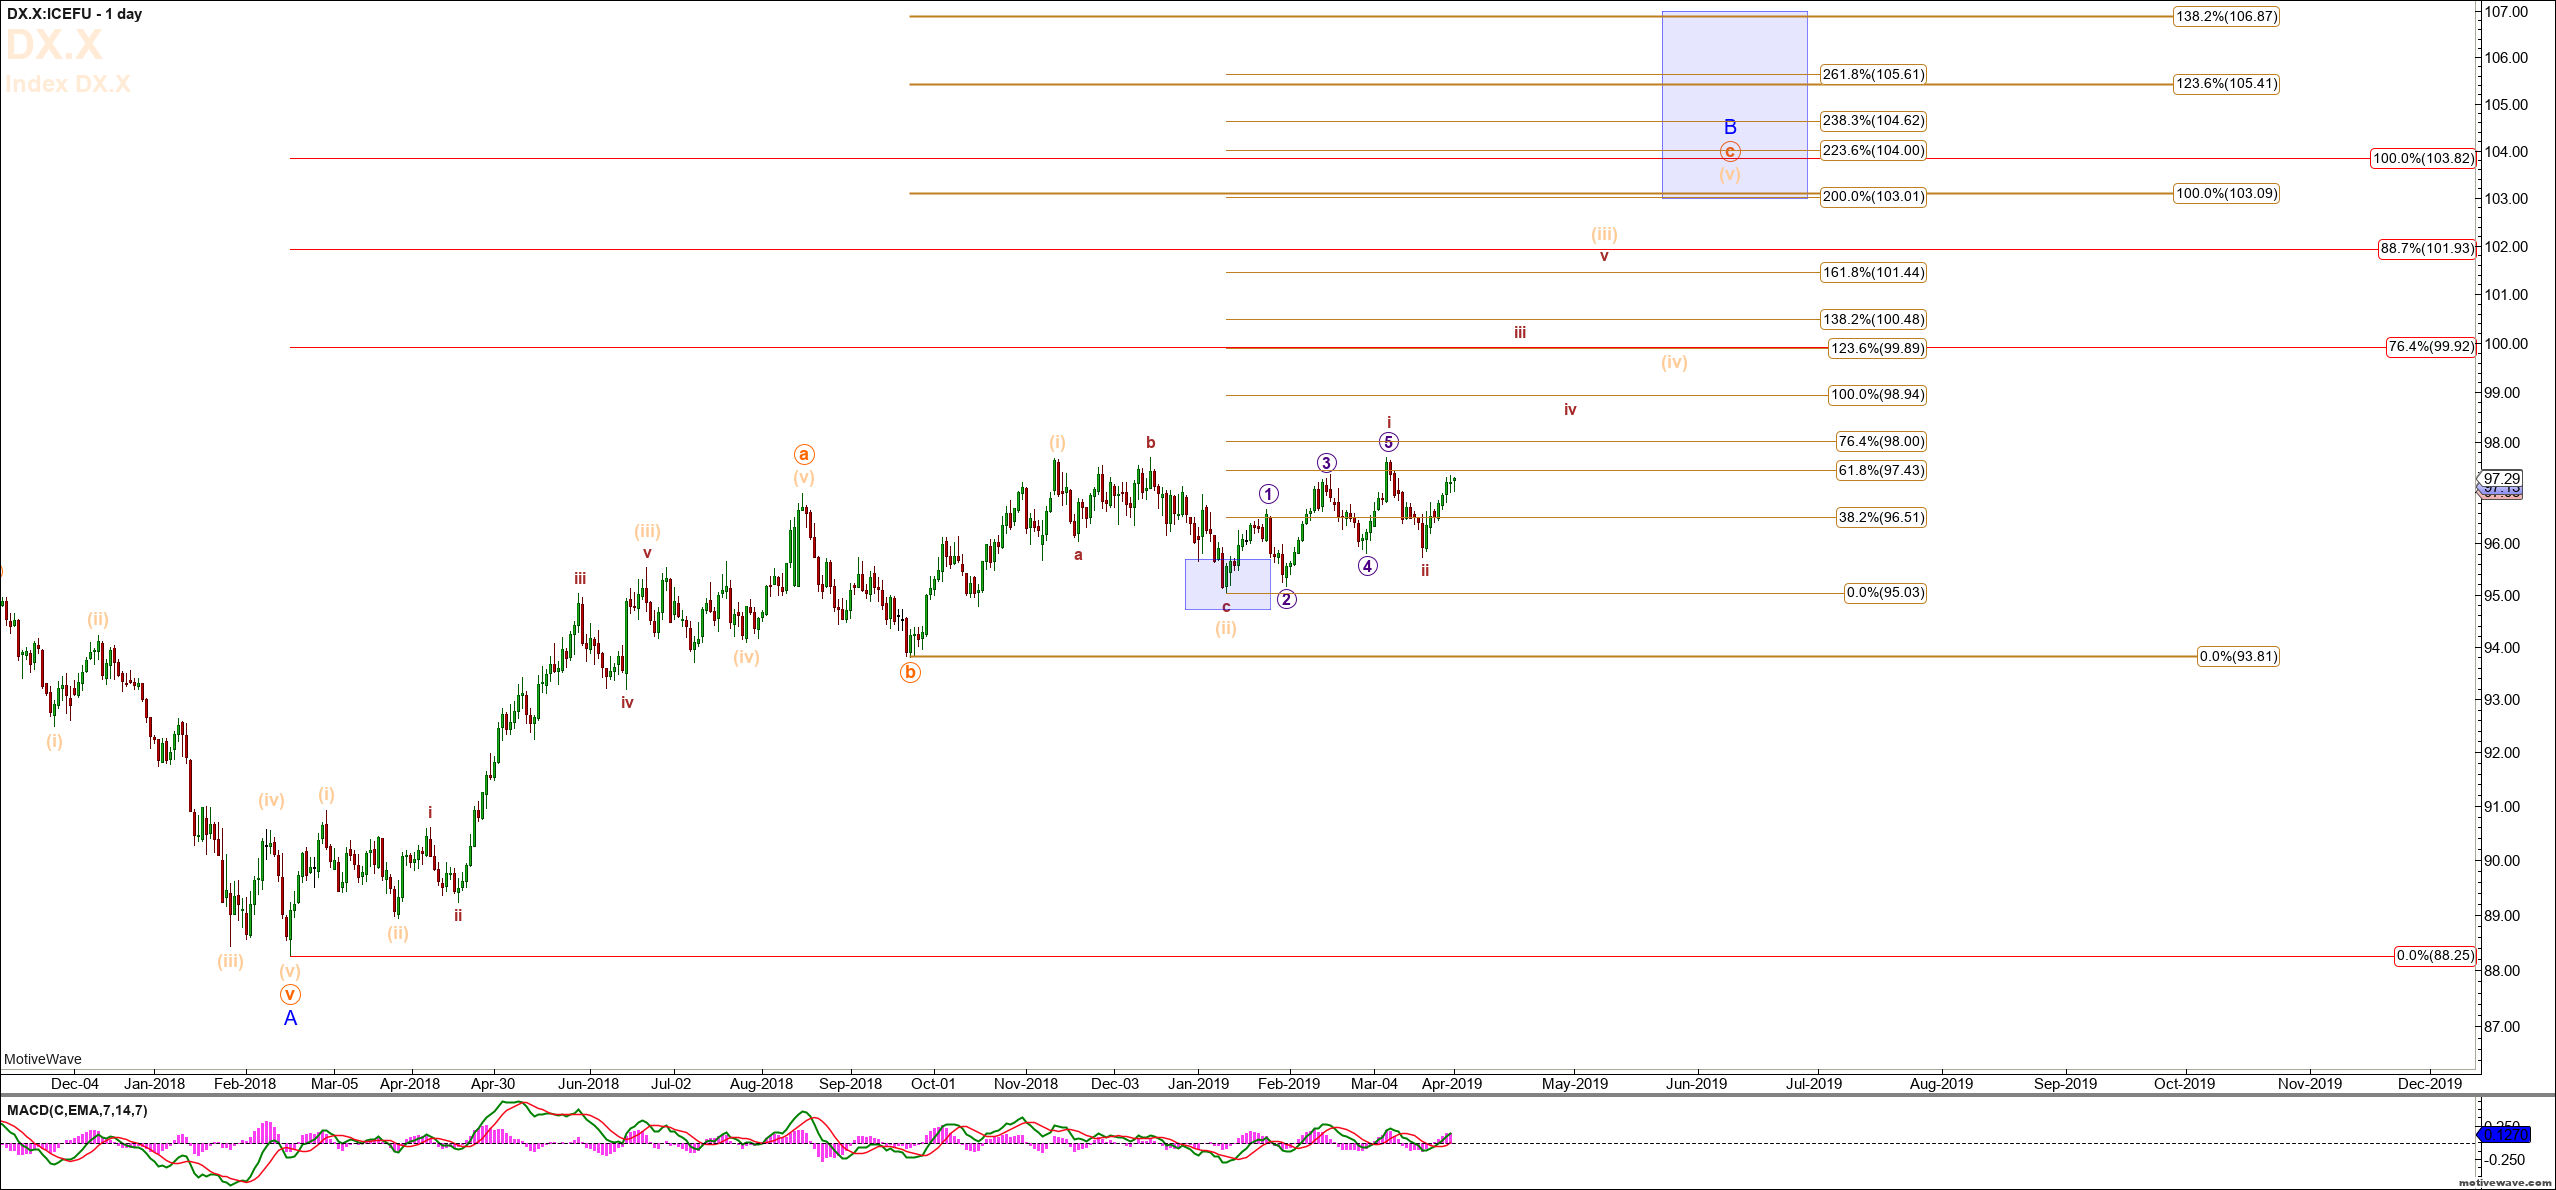
The pattern suggests the USD will rise into this summer.
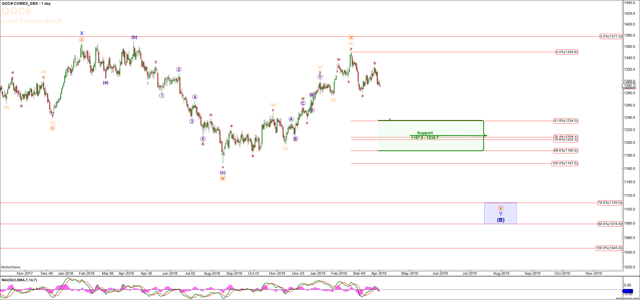
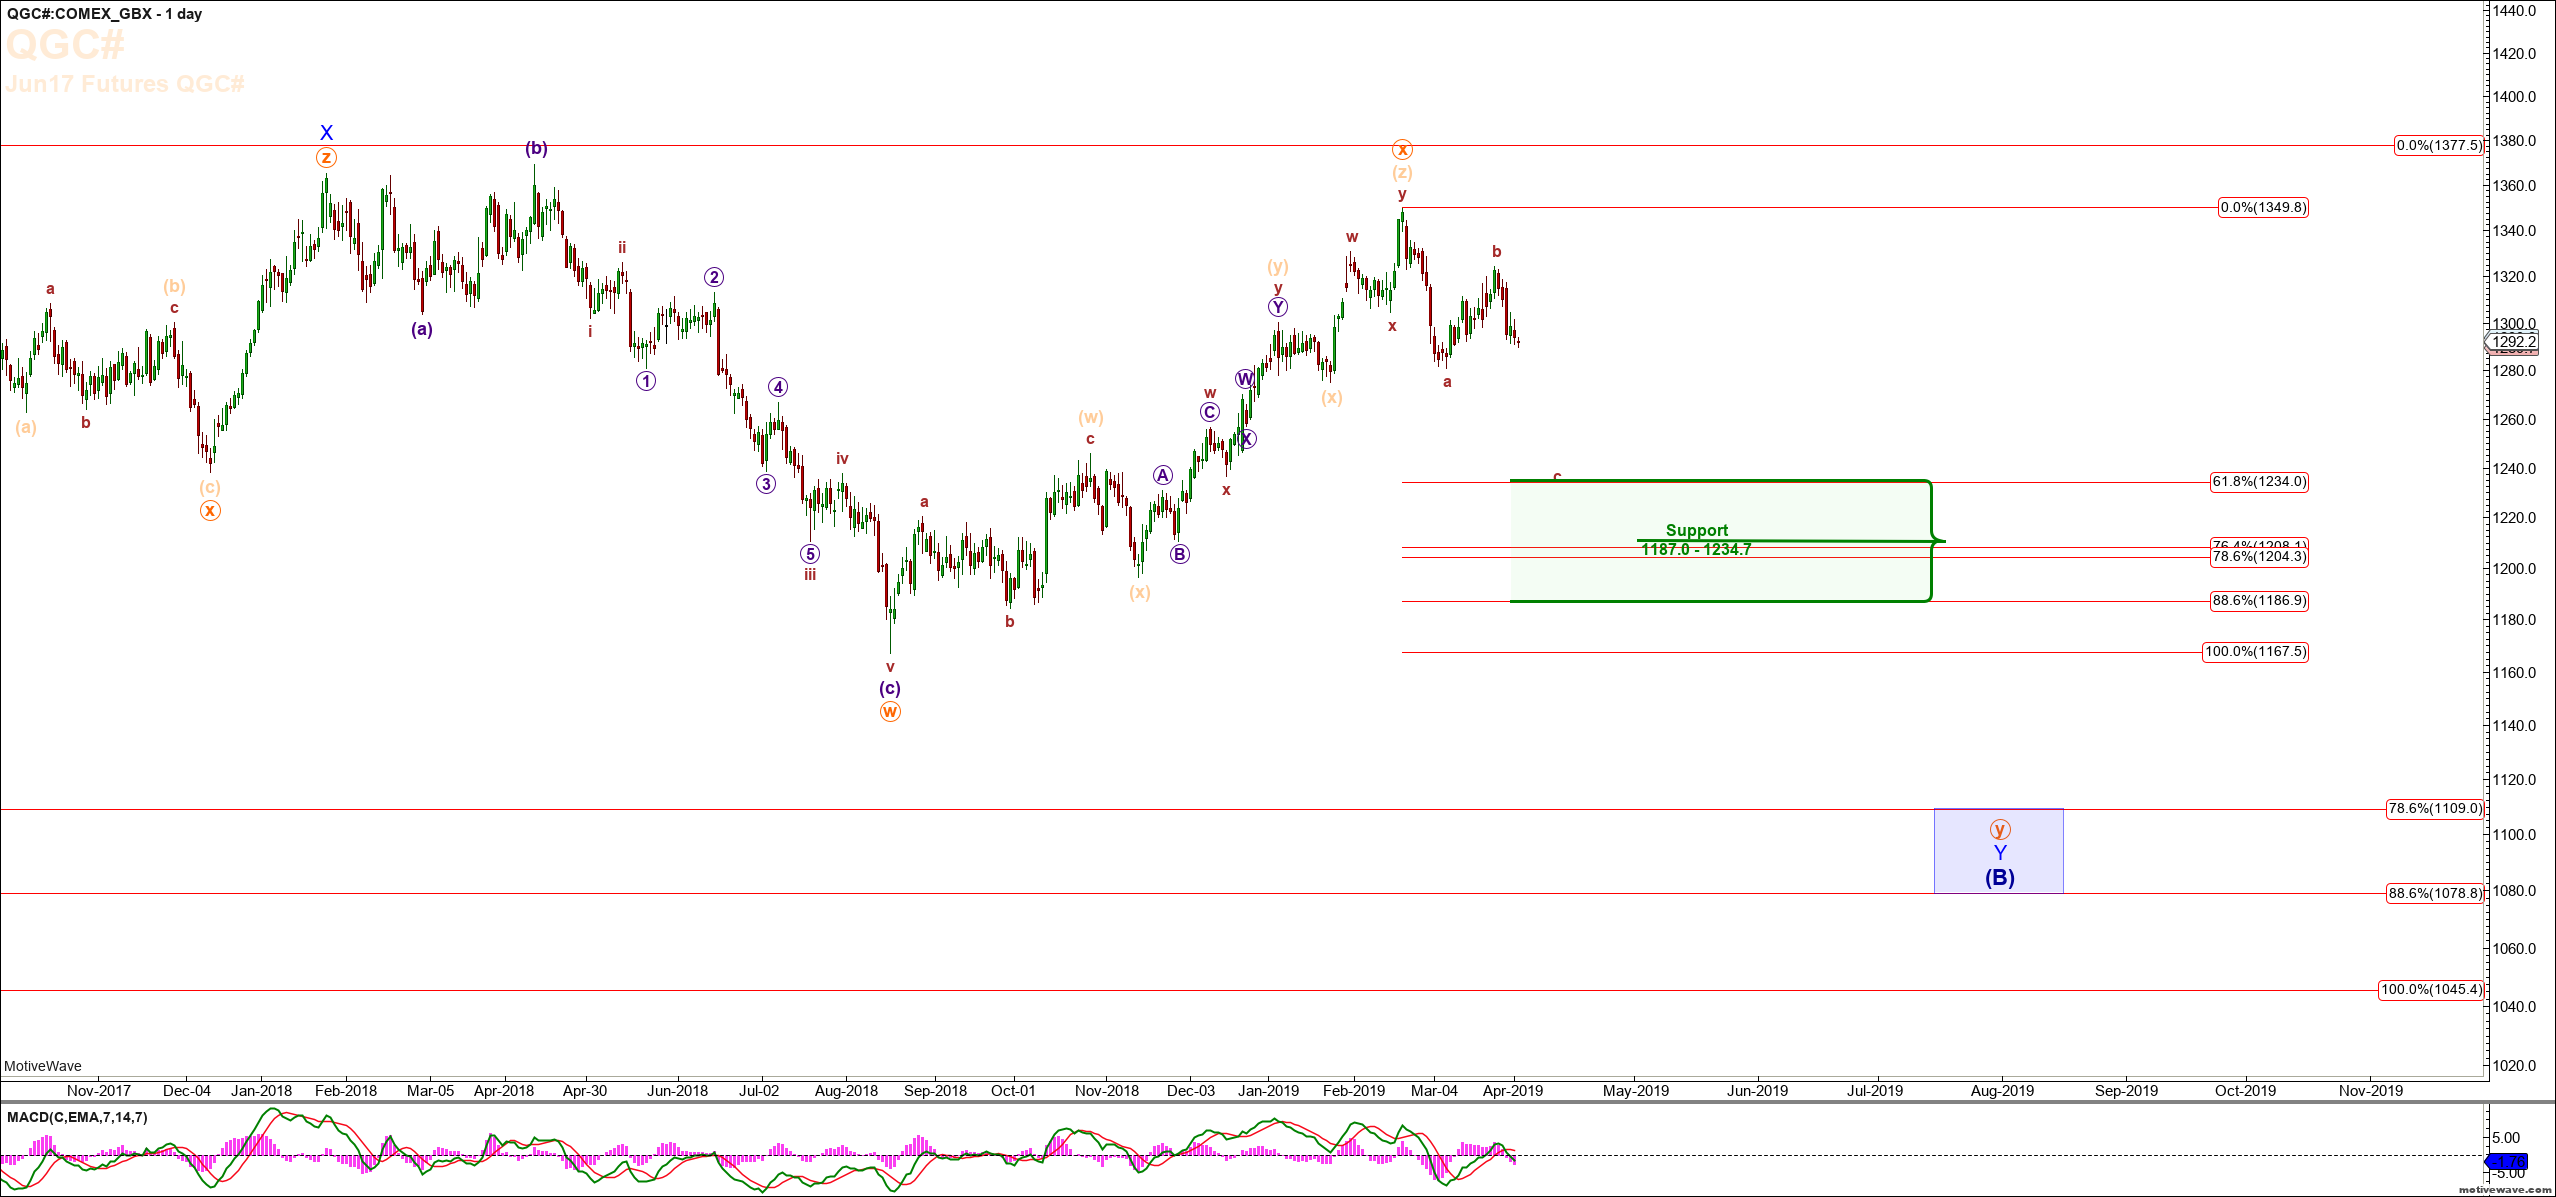
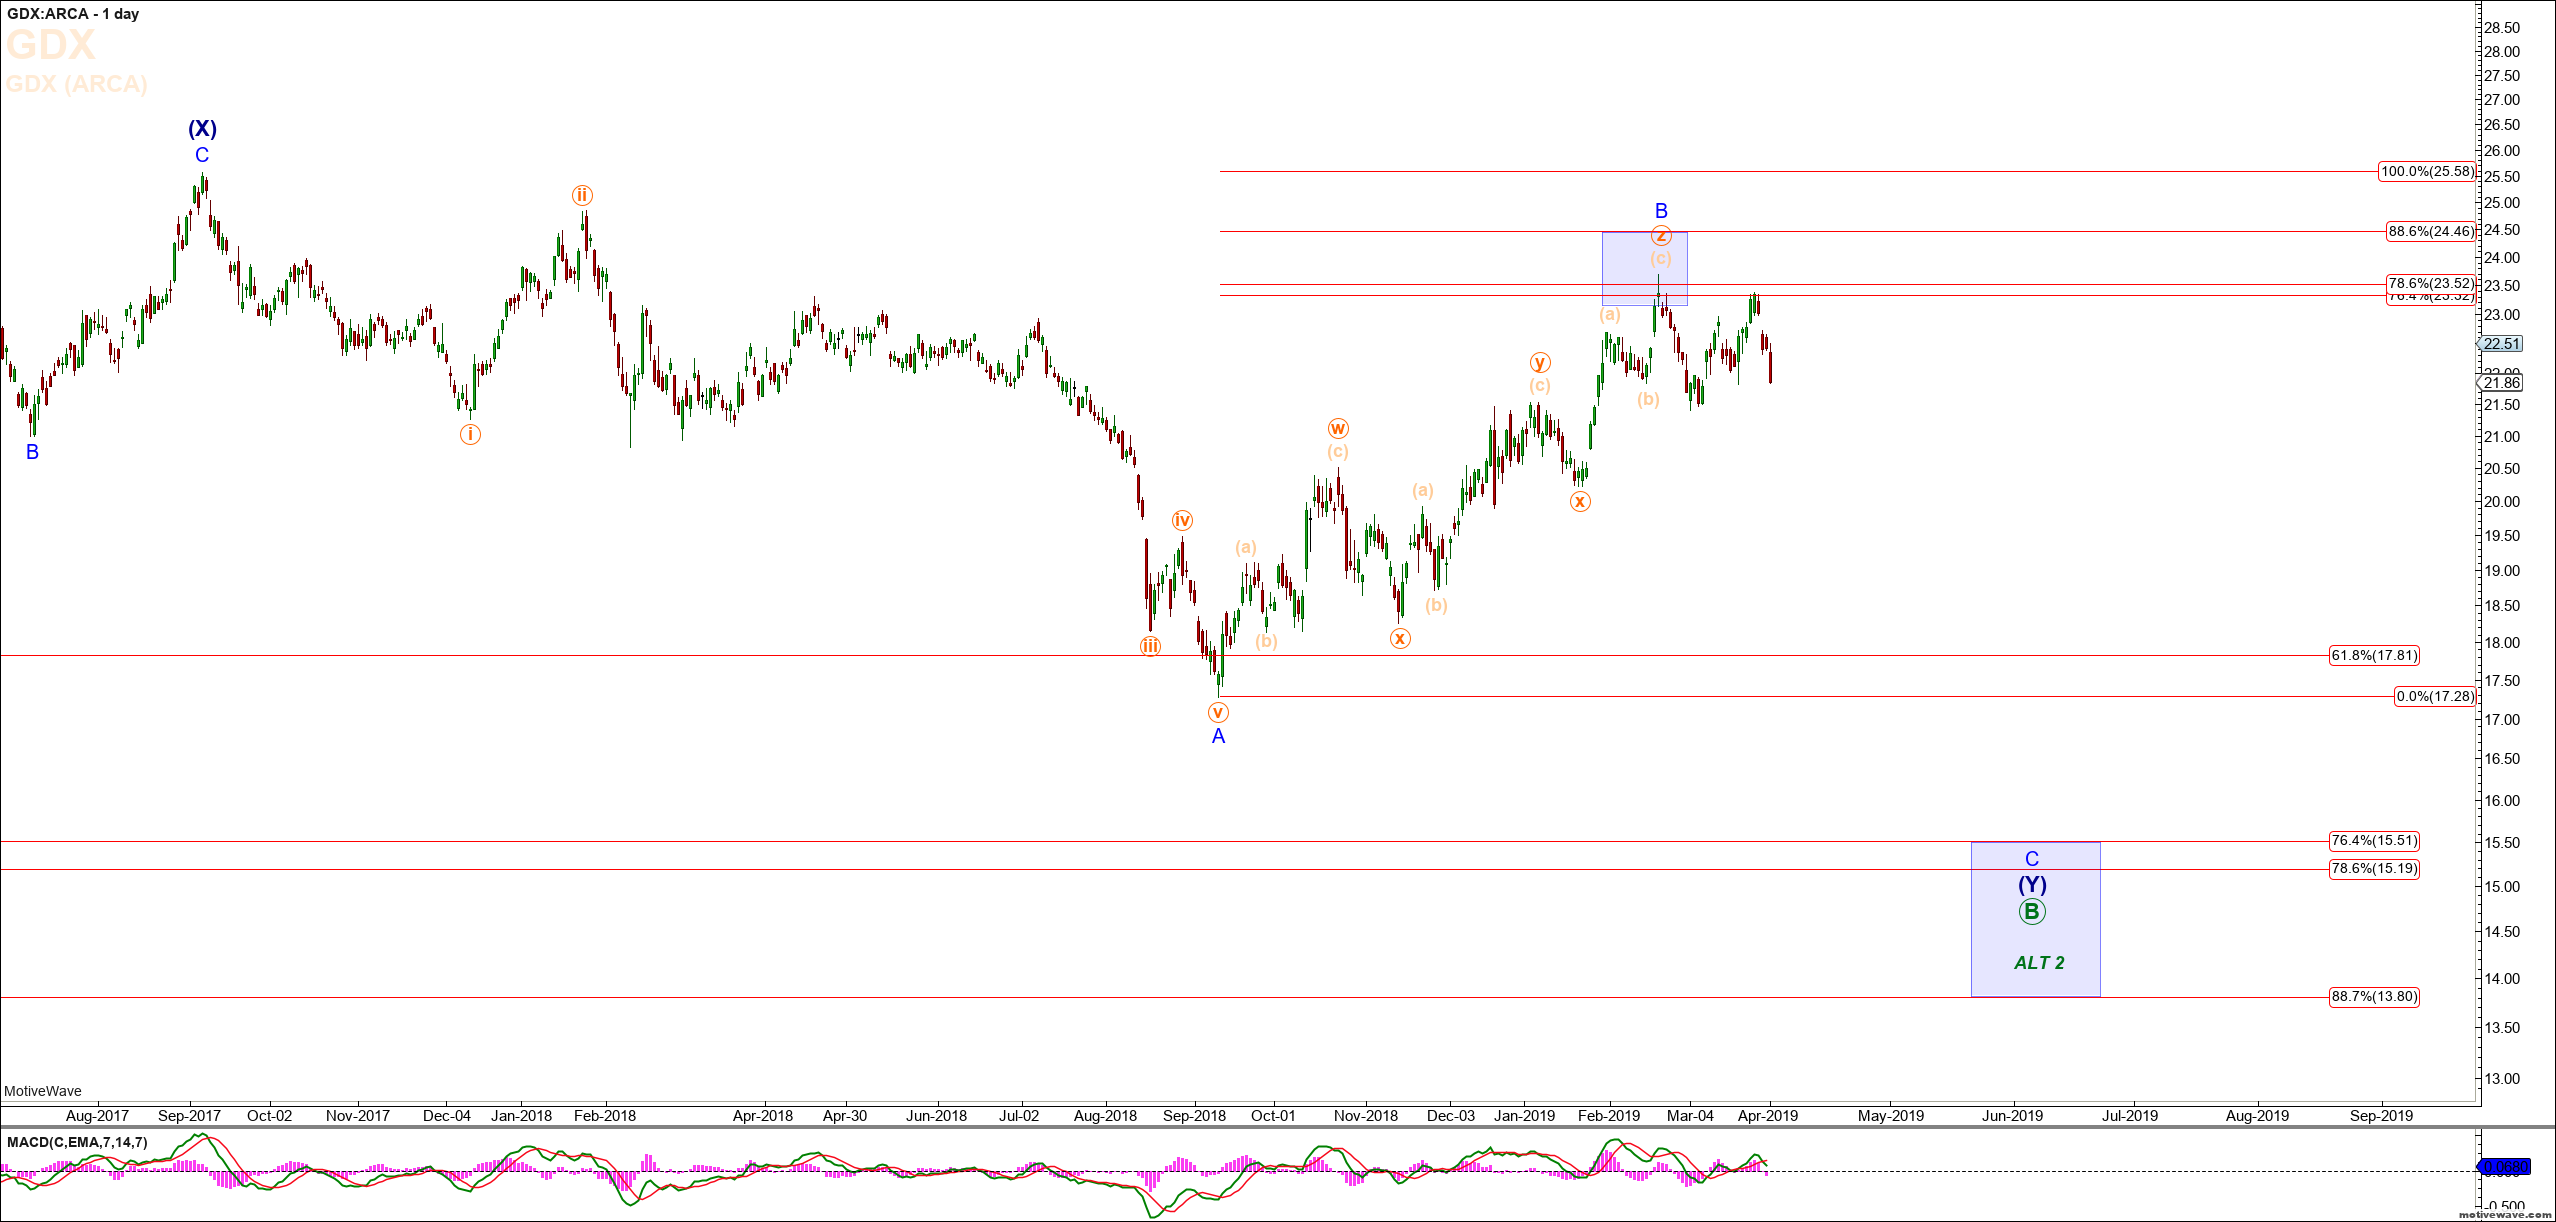
The pattern in gold and the miners sector suggests lower movement into this summer.
We have solid price targets and a number of key clues to suggest when and how we will go long the precious metals mining sector.
Analysis and investors alike have grown frustrated by the sectors continued false breakouts. Hold on, it's about to happen again.
For many years, I've watched the metals and miners sector frustrate investors and analysts alike by offering signs of the elusive break to the upside only to repeatedly fail. Even recently, I received a flurry of emails from those suffering from the "fear of missing out" syndrome, which was looking to go long near the recent highs. To quote the late Joe Granville - "If it's obvious, then it's obviously wrong".
Our expectations for the metals and miners complex has not changed since the peak that occurred in 2016, which is for an expected move in gold to the $1,109 region and a move in the VanEck Vectors Gold Miners ETF to the $13.80-15.50 region. Because of this, our subscribers have been able to treat the intermediate moves as trades versus long-term investment positions. That said, the time is drawing near when we will be looking to build our long-term portfolio of fundamentally sound mining stocks at what will most likely be the very moment that those most frustrated are throwing in the proverbial towel on the sector.
It is true that we have been looking for a move into our target region for some time now. In the last two years, gold has started a strong descent only to catch a strong bid late in the year in both 2018 and 2017, offering up what can best be described as an overdose of Red Bull to the Bulls, who will only come crashing down as the high wears off. It is very likely the next drop will put the final nail in the perma-gold bulls coffin just as this frustrating consolidation finally concludes.
Interestingly, the US dollar is set up nicely to rally from current levels up to the 103-107 level at the same time that gold drops to the $1,109 level, exhibiting the historical inverse correlation between the USD and Gold. However, note on the Daily Gold Chart, the support area noted in green in the $1,234-1,186 region. In the event the USD completes into the target region - shown on the Daily USD Chart below - coincident to gold holding this upper support region, we will not make the mistake of allowing stubbornness to get in the way of making a profit and will go long the miners sector.
Most of the individual miner stocks have reasonably clear chart patterns that will allow for entries at one of several notable retrace fib levels. Investors may well find themselves in a position where they have to take several attempts to build a solid portfolio of miners. The first attempt being when they hold one of these retrace levels and provide a hearty bounce, allowing one to enter a break even stop out level, and then the second if this level fails to hold and GDX comes down to the lower target region.
Managing capital is completely about risk management. If you manage your risk appropriately, then over time winning positions will dwarf losing positions. The delta in the value of mining stocks that resides between the upper support region in gold and the lower price targets, as shown on the Daily Gold Chart, is quite extreme and, in many cases, can be as much as 30-50% in share price. To put this differently, if you go long individual miners when gold reaches the support region shown on the daily chart and simply ride those positions while gold drops to the lower target of $1,109 on some of your positions, you will see a 30-50% drawdown in value. For some, this might be okay. For us, it would be an unacceptable drawdown in the value of ours or our client's capital. I say this for two reasons - 1) It is completely unnecessary if managed properly and 2) A drop of this magnitude would allow us to purchase significantly more shares from the lower price targets.
All this to say, there could be two levels that gold pulls back to before it turns up and begins to accelerate, and until we can formulate more downside action, at this moment in time, we cannot say which is more likely. However, we do expect one of these two areas to hold.
What we can also say is that our Hurst Cycles timing model suggests that gold will most likely bottom in late July to late August 2019 time frame.
So, we have several major clues we'll be focused on in the coming months in order to get long the mining sector, which are - 1. Hurst timing, 2. Downside pattern in Gold, and 3. The USD targets to the upside concluding coincident to Gold bottoming.