| Posted by Brian Fletcher on 14/08/2019 | 0 Comments |
The move down in equities into the August 6th low is only the initial move of a multi-month correction that will ultimately catch many investors off guard.
The technical breakdown that occurred on the initial drop was not only foreseeable, but now portends continuation with much lower levels still to come.
The move down will not be a straight forward linear move. It is corrective market action, and along with corrective action comes increased volatility and false starts that resolve downwards.
This article was originally published on Seeking Alpha click here to see the original article.
As most investors intuitively understand, equities cannot continue straight up in a linear fashion. The move up off the December 2018 low has been quite impressive indeed, and while long term we still expect higher levels to be reached in US equities, the technical breakdown that occurred into the August 6th low, and that we had forecast in our article dated July 31st suggesting an overall 25-30% correction is only the beginning phase of a correction that will likely span through late spring to early summer 2020.
In this article I will discuss the larger overall price pattern for the S&P 500 off its 2009 low, and how it relates to our expectations for price levels and timing for this current downside correction.
By way of background, we entered short for both our investors and subscribers by purchasing a full position of shares in ProShares UltraShort S&P 500 SDScoincident to publishing our last article suggesting the move lower, and then exited this position near the low in anticipation of a bounce, as I will discuss further below. Upon the bounce, we have since re-entered a half position and are looking to add to this position for the next phase in this correction.
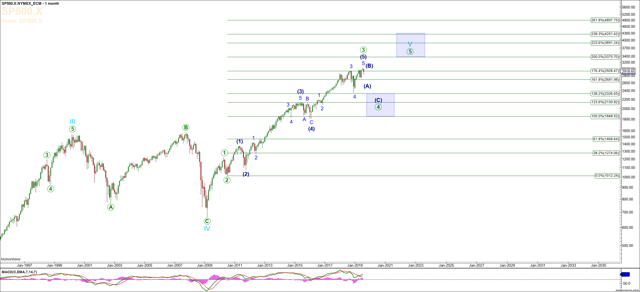
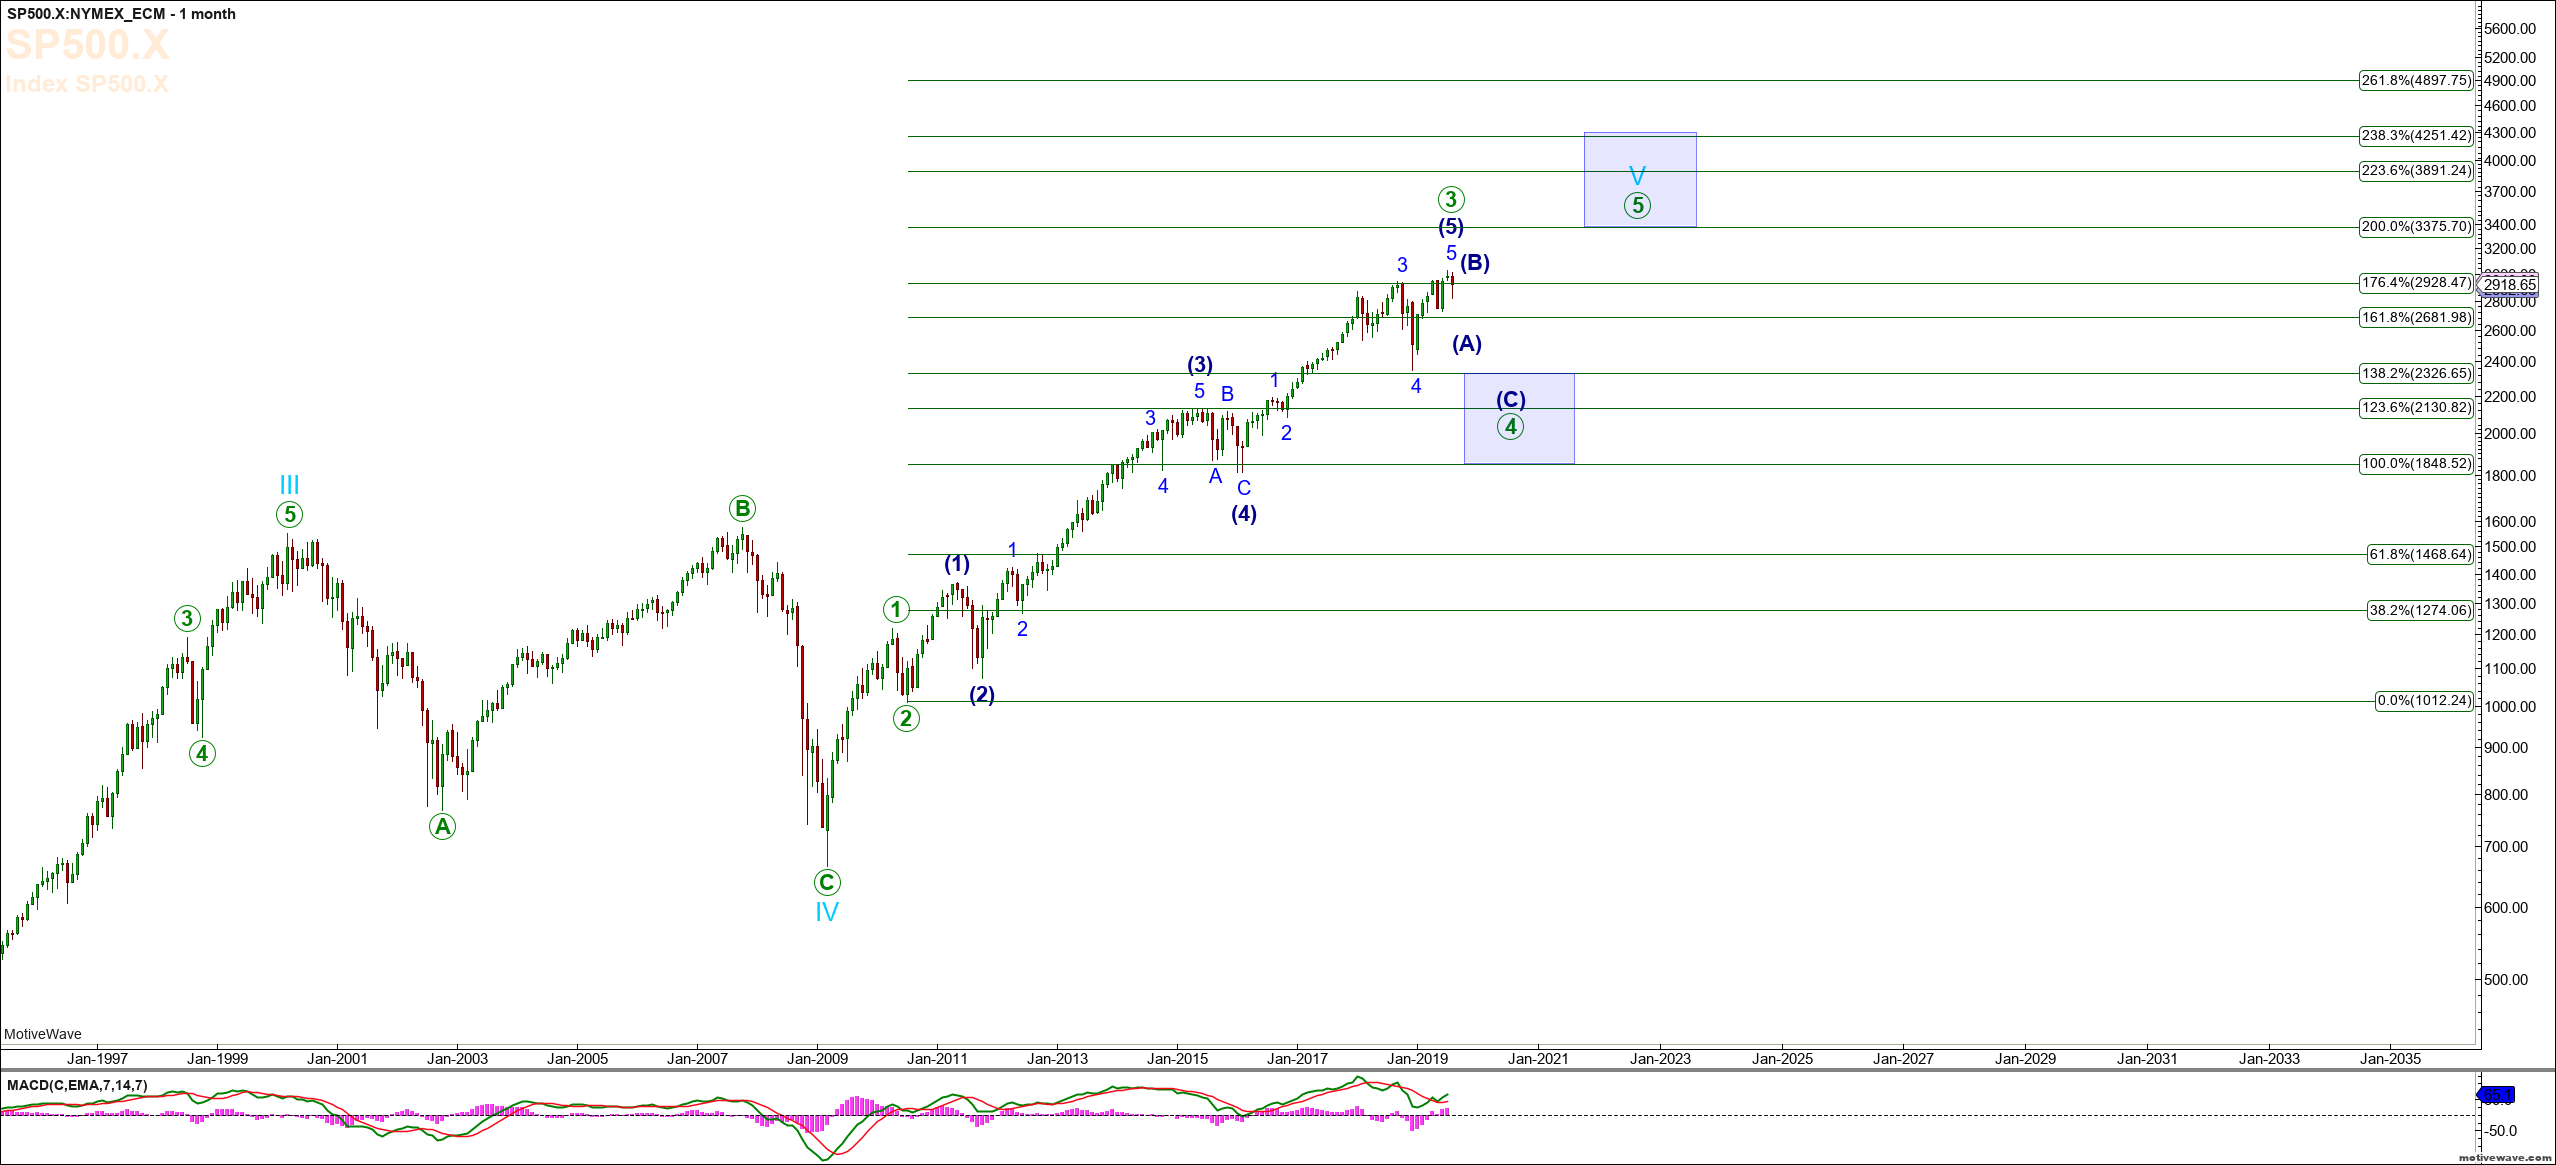
To better understand how this correction fits into the larger price pattern of the move off the 2009 low; please refer to the S&P 500 Monthly Chart below, and allow me to discuss why our expectation of this correction is so prescient. Elliott Wave patterns, when used with Fibonnaci extensions and retracements, are extremely reliable measurements of stock market activity, as there is no more measurable form of overall sentiment than how investors as a group, or what we often refer to as the "crowd", react where their hard earned money is concerned. Market patterns, or fractals as they are often referred, are not only measurable, but are repetitive. Put simply, investors react similarly over time to their decisions to buy, sell, or hold securities, and there is no better method to measure the decisions of the crowd than by assessing the overall chart pattern. To better illustrate this, please note that the S&P 500 is forming an overall impulsive or 5 wave structure off the 2009 low. We would normally expect that the primary degree wave (3) would hit the 1.236 Fibonnaci extension level, which it did in picture perfect fashion into May of 2015, and then we would expected it to hold on any pull back the 1.0 Fibonnaci extension, which it also did in picture perfect fashion into early 2016. Since then the S&P 500 has come up to the 1.764 extension level and turned down. We would normally expect the 1.618, 1.764, or 2.0 levels to hold as the primary degree wave (3), as shown on the monthly chart as the green (3), which again has done so in picture perfect fashion. Collectively, the move off the March 2009 low has now satisfied what can best be viewed as having completed an Elliott Wave Primary Degree wave 3 up. What comes next is a corrective Primary Degree wave 4, which would portend an overall pullback to the 1.382 at 2,326, the 1.236 at 2,130, or the 1.0 at 1,848. This represents a correction that can range from 23% to 39%. However, typically a 3rd wave that extends to the 1.764 extension will retrace to the 1.382 or 1.236 extension levels, hence our suggestion that this correction will range between 25% and 30%.
 Next turn your attention to the S&P 500 Weekly Chart below. If topping patterns are difficult and can drag out for a period of time, corrective market action can be considerably more difficult. Corrections tend to last much longer...continue reading at Seeking Alpha.