| Posted by Brian Fletcher on 04/10/2019 | 0 Comments |

Natural gas is setting up an enormous upside move, but there are multiple ways to position for this move.
There are nuances relating to the interpretation of the pattern that relate to the front month and continuous contract price levels and lend to several different scenarios playing out.
All counts lead to higher over the longer term, but another low potential is still very much a possibility.
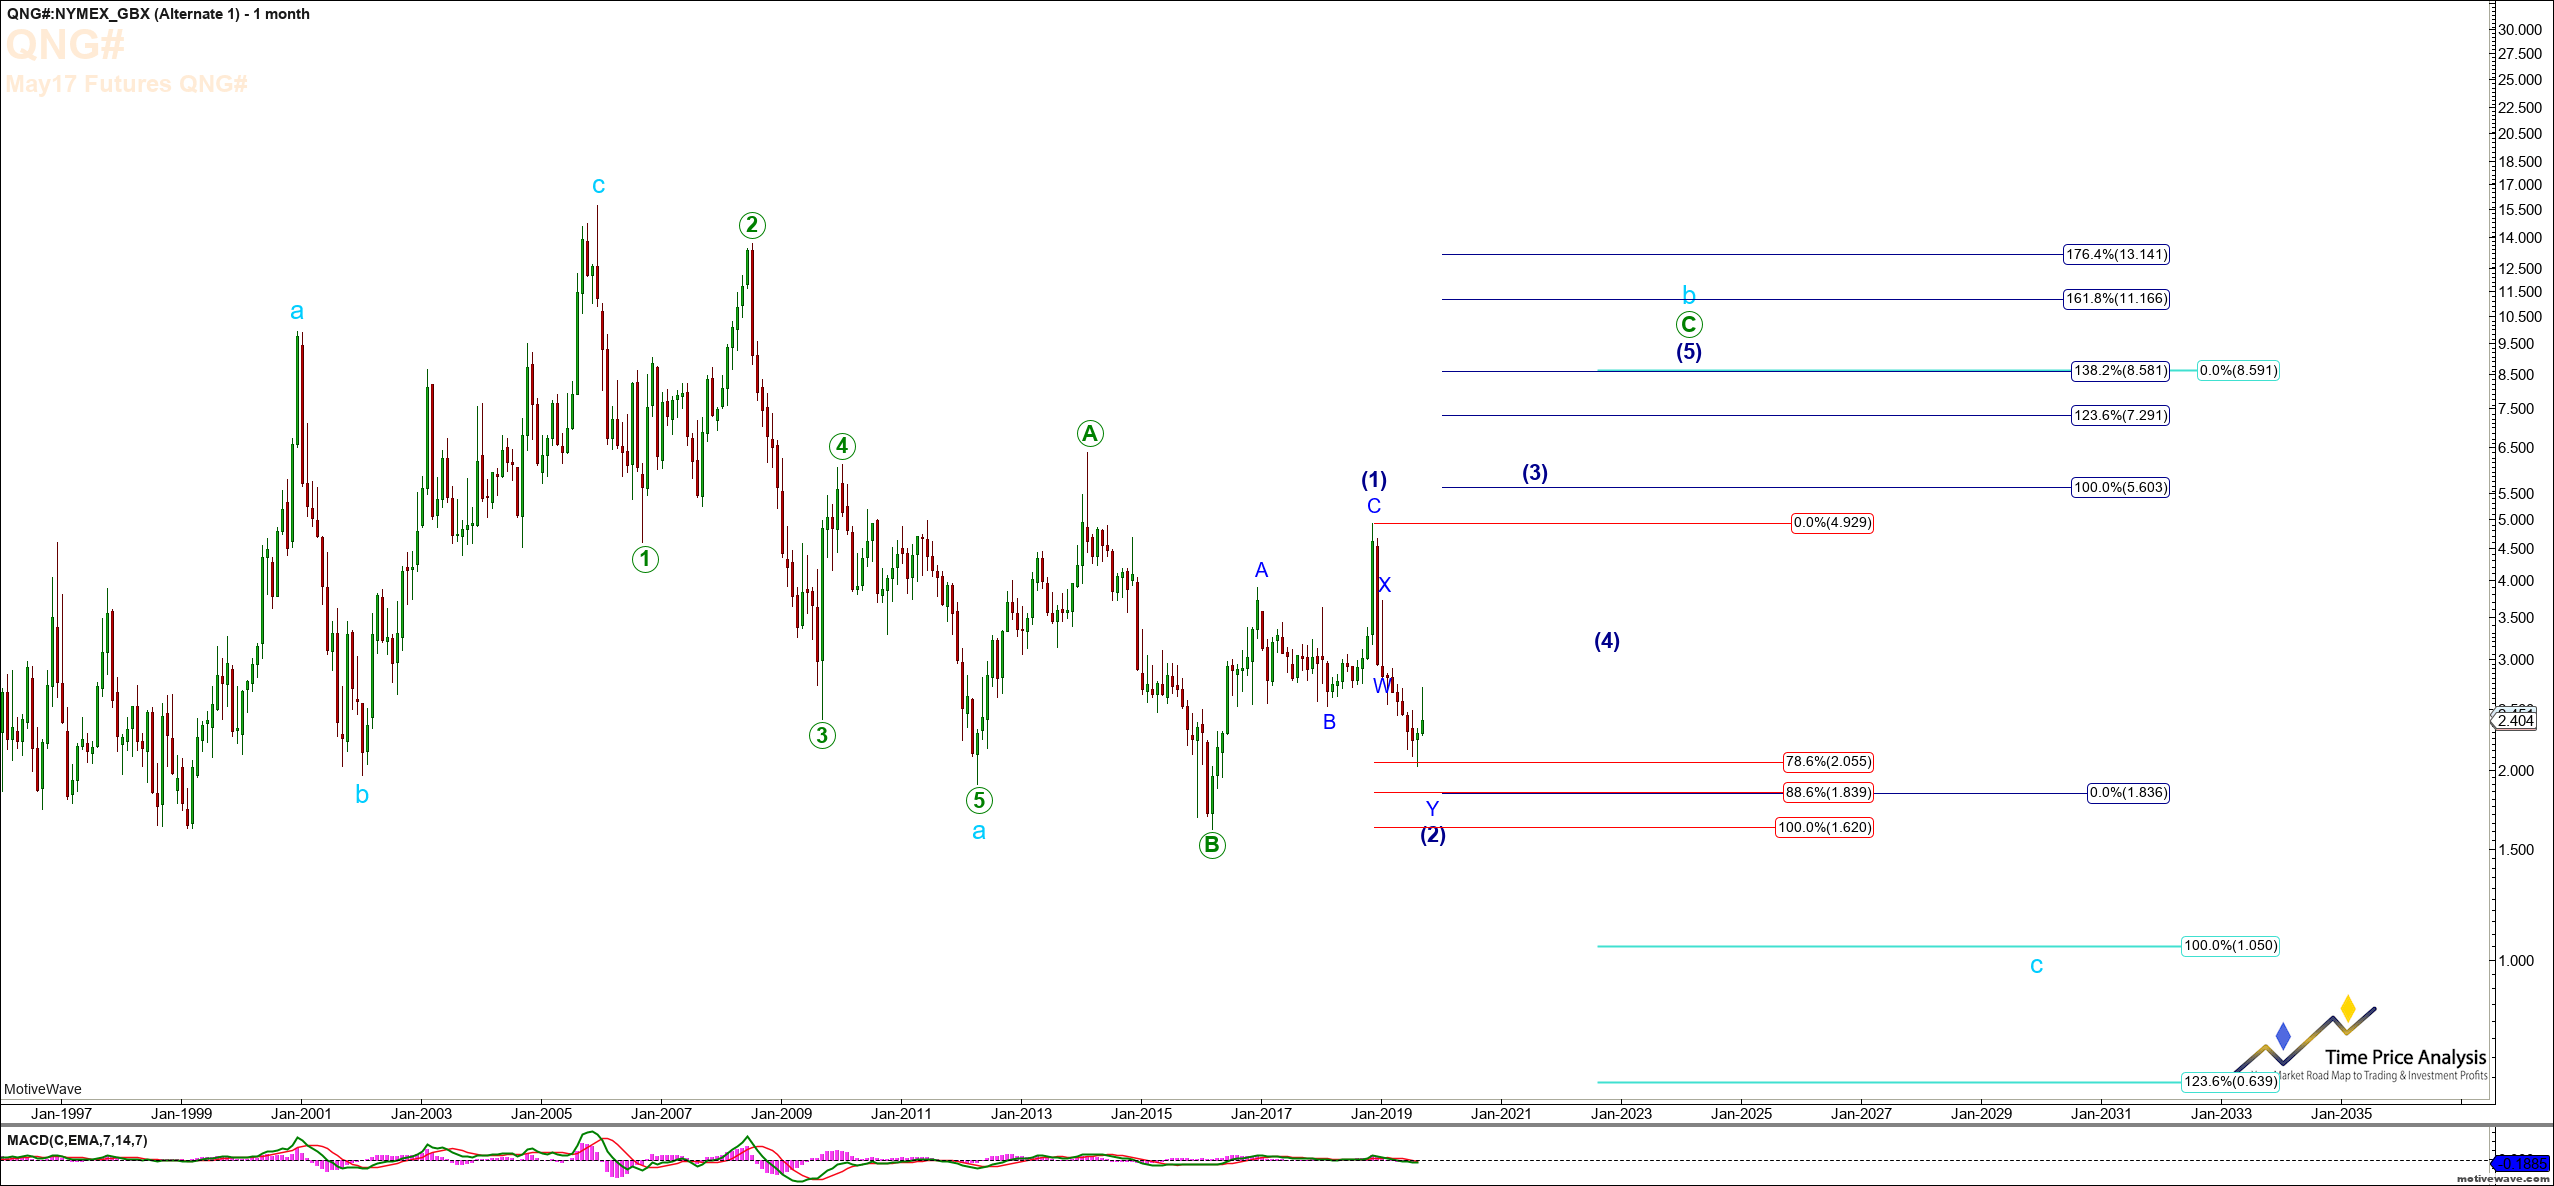
I want to take a few minutes to discuss natural gas in the context of how one might create a trading plan to take advantage of the upside. To start with, let's look at the monthly chart, below.
We are expecting a 3rd wave up to the $5.60 to $7.30 region in natural gas that can transpire over several years. However, note that we are viewing this as a diagonal count, which means that wave (3) will result in an A B C pattern similar to wave (1). When looking at the A and the C of wave (1), it is apparent why there's so much focus on natural gas. These moves are parabolic and vertical in the way they move, hence the reason none of us want to miss them. However the real question is how does one get long, and at what price level.
In evaluating this, it's important to understand that none of us are perfect traders, and how you enter long will vary based on your own tolerance for risk and how much draw down you view as acceptable. Some might decide based on what I discuss herein to simply go long now and ride a potential move lower, while adding to their position if natural gas obtains another low. Others might risk missing the move up, but be more patient for the perfect setup to occur, where there's a risk of a perfect setup not presenting before NG simply taking off to the upside, thus leaving them behind. Others might choose to layer into shares of UNG at each fib hit as NG drops. I can say with a certain amount of experiential authority that until this upside commences, no one way to enter long is exactly the right way, and we won't know for certain which approach makes the most sense until after the fact.
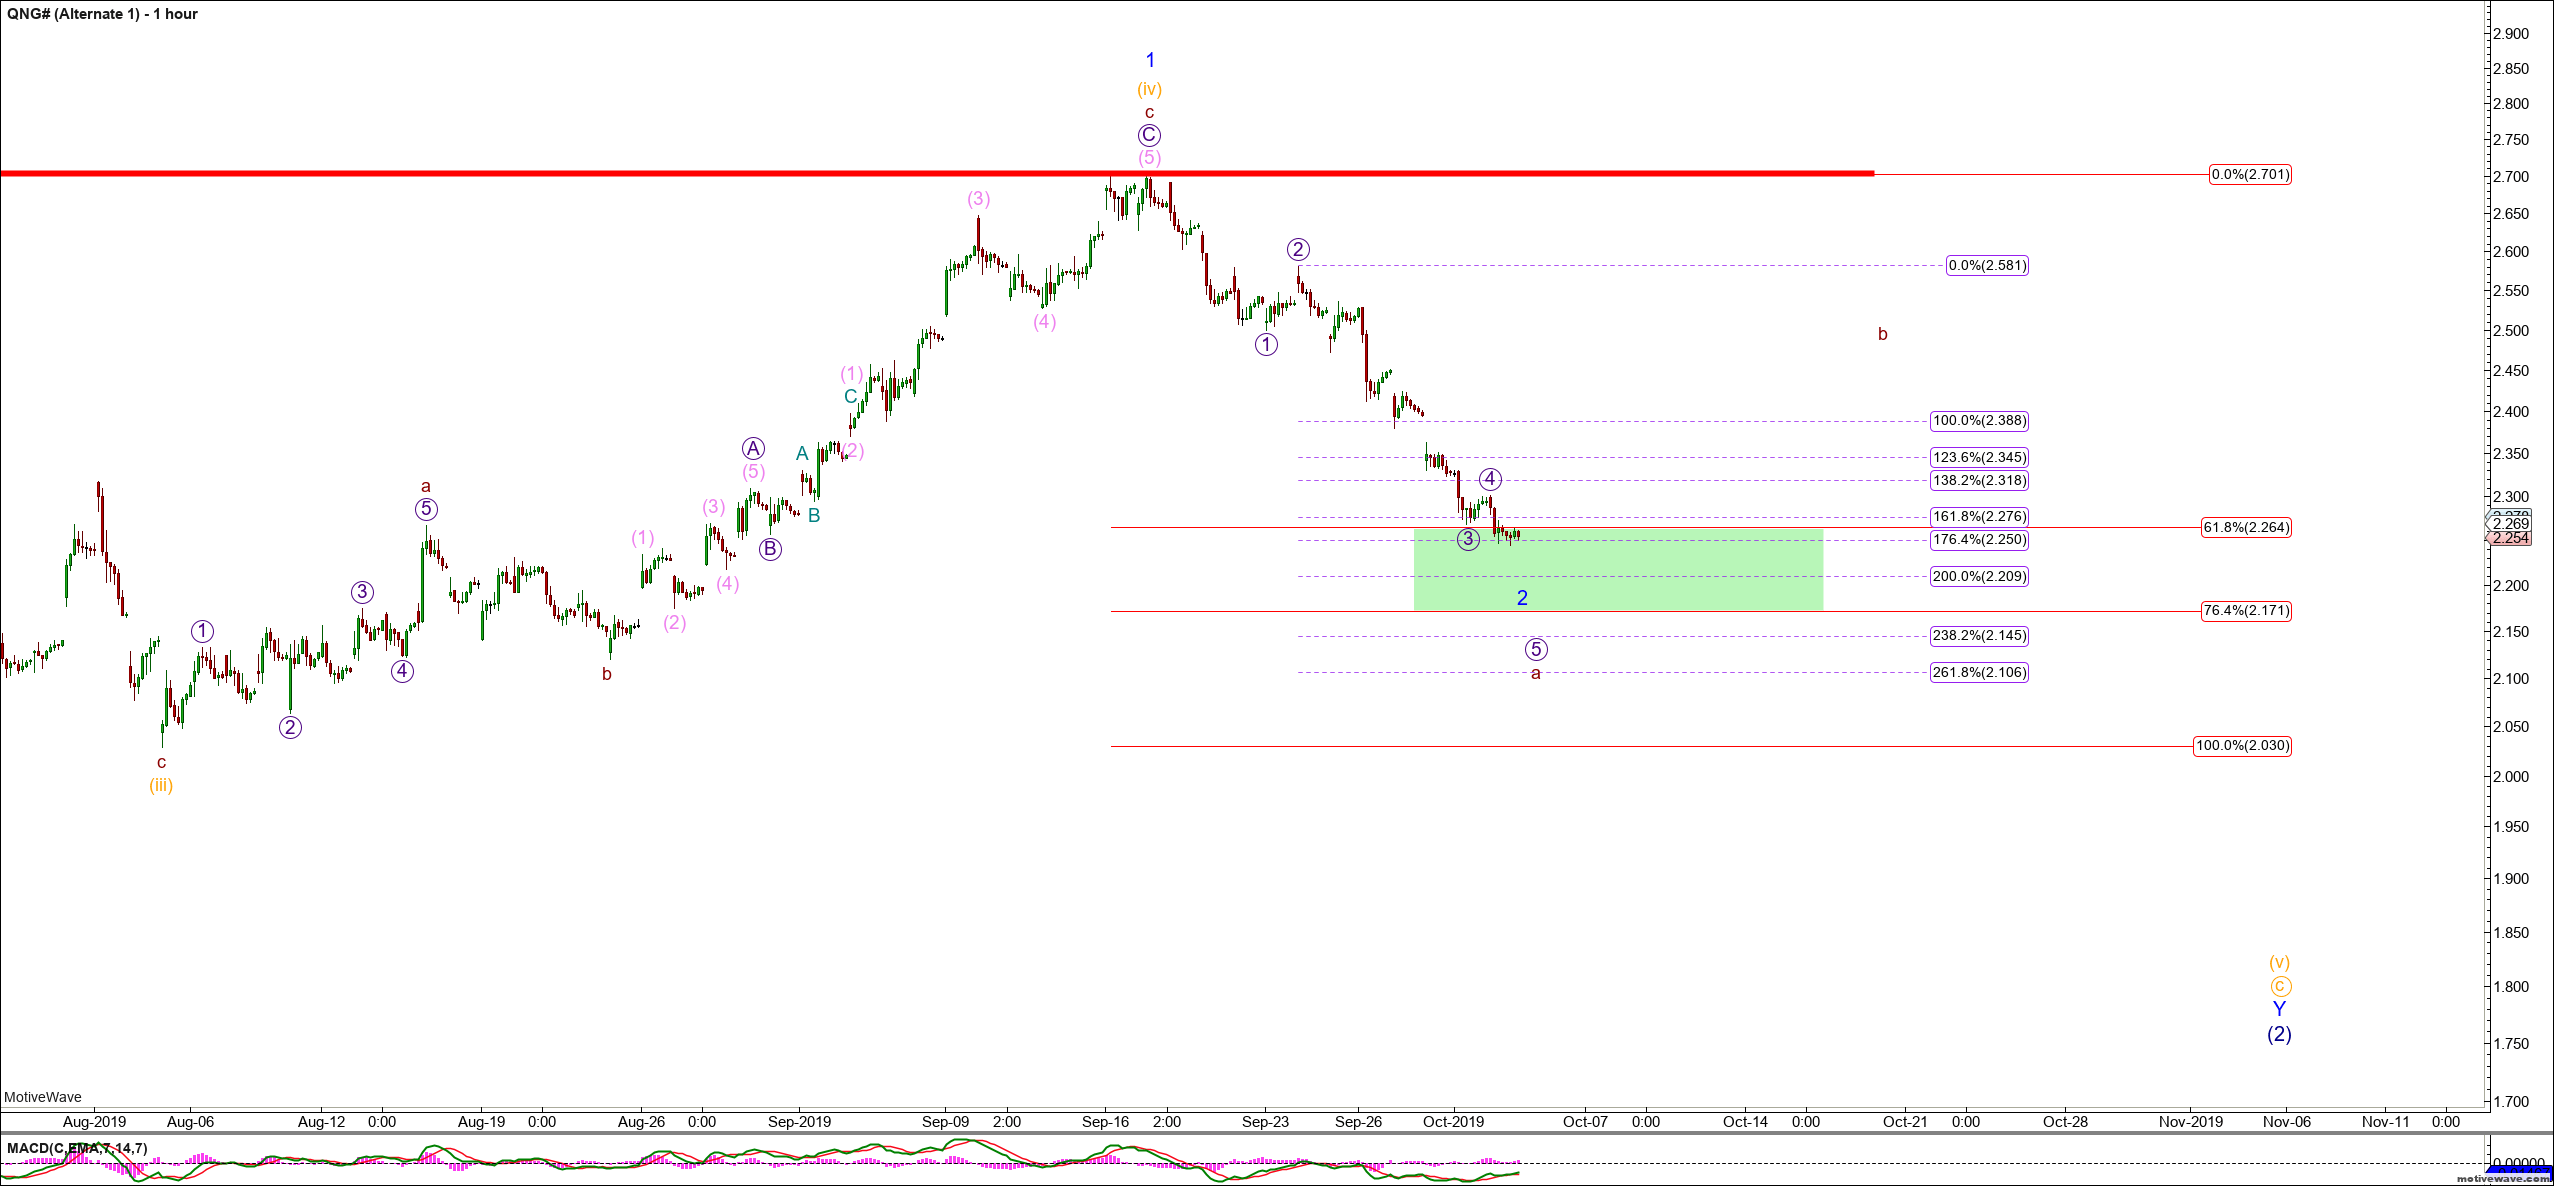
One view is that NG is completing an ending diagonal 5th wave to new lows that would ultimately target the $1.93 - $1.82 region. However, diagonals move in three wave moves, which would suggest that the current move down is an a-wave of this 5th, and would thereby fetch a move back to the $2.50 - $2.60 region to complete a b-wave before heading to new lows. See Hourly chart below.
 However, there's another perspective that might be counter to this expectation that can enable one to have their cake and eat it too.
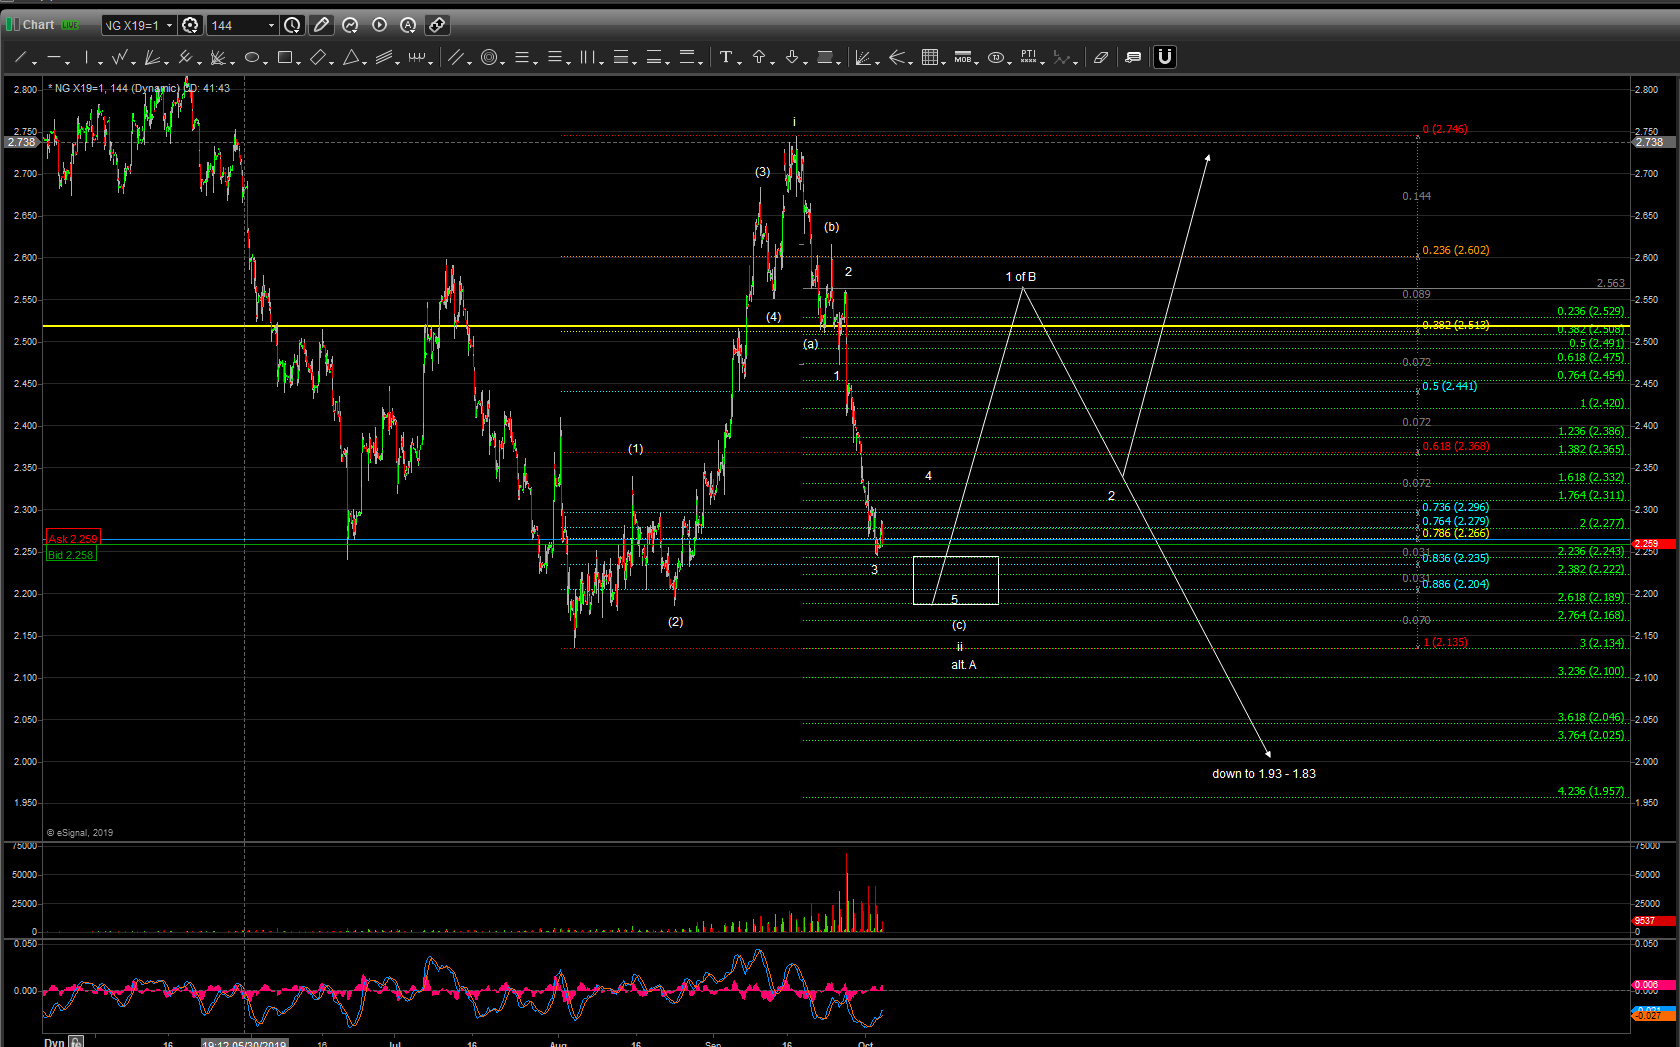
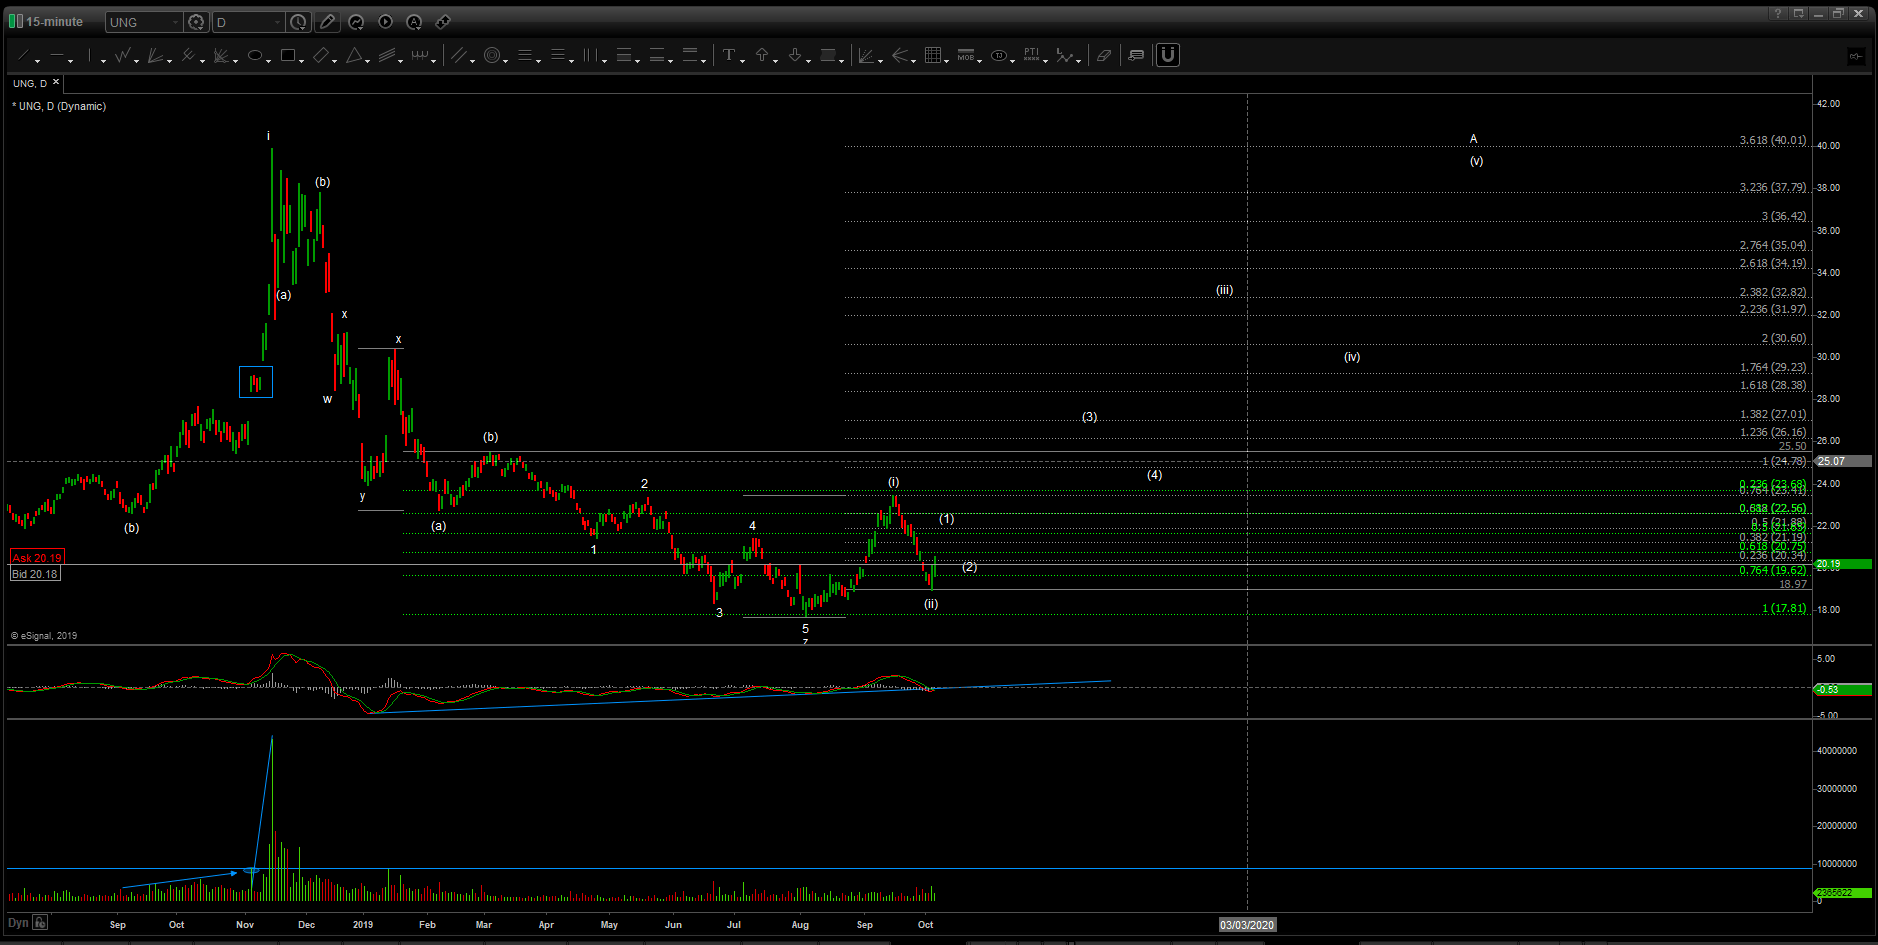
Note the following chart of the front month contract in NG, which suggests the potential for a i ii setup. The difference between the front month and the continuous contract lies primarily the fact that the front month contract has different pricing highs and lows to that of the continuous contract, which takes into consideration the highs and lows established by the previous front month at the time it rolls over to include the current front month. To illustrate what I mean, the continuous contract shows a .786 retrace level of 2.175, as shown on the NG Daily chart below, whereas the prior low for the November contract is at 2.135. All this to say, as long as 2.135 holds, this can be a i ii setup on the front month contract, whereas if this level breaks, but holds over 2.028, as shown on the daily continuous contract, then the continuous contract i ii setup can hold.
Perhaps in understanding these nuances you can begin to better understand the difficulty in finding the exact low with total precision.
 NG Daily Chart
The ETF that tracks with Natural Gas is United States Natural Gas Fund, LP (UNG), and assuming the low was established at this last low, here is our the move up in UNG will most likely unfold.
So, how does one enter?
For those unfamiliar, in Elliott Wave terms, a i ii 1 2 setup is the most attractive trade entry, where there is a wave i and ii, followed by a wave 1 of iii and 2 of iii.
Our approach will be to layer into initial non-leveraged shares of UNG near the recent low in anticipation that the next move up with either be wave 1 in a i ii 1 2 setup, as shown on the 144 minute chart above. Whether NG is forming a diagonal 5th wave that consists of an a b c to new lows, or a i ii 1 setup, both price levels project higher from that of current levels. This will then allow us to use shares of DGAZ from the peak established on the next move up in order to not only hedge longs, but take advantage of a potential c-wave down to new lows. If the c-wave fails to follow through, we will simply stop out of the DGAZ position and allow our primary long position in shares of UNG to ride upward in a 3rd wave to new highs.
How you choose to position for the move up in natural gas will be based entirely on your own perception of risk and the risk to reward potential being offered by NG. While no one plan can necessarily be wrong, it's important to have a plan and stick to that plan. If there were a few relevant pieces of trading advice I could provide herein, they would be: Do not use leverage in this part of the pattern, and until NG has provided evidence that the low is in, as riding a move down with leverage would not only be very uncomfortable, but would likely prohibit you from adding at the key price levels, and phase in positioning by taking an initial half position, and then looking to add to this position on the completion of a i ii 1 2 setup, as shown on the 144 minute chart above.
When it happens, the move up in NG will be fast and furious, but one can get whipsawed until it actually does happen, so have a plan, be cautious in how you enter and then layer in upon key fulfillment to the pattern confirming that the low is in.