| Posted by Brian Fletcher on 07/10/2019 | 0 Comments |
US Equities are setup in picture perfection fashion for a drop into mid to late October.
Corrections are a process where markets provide choppy indecisive behavior followed by fast and furious moves to the downside.
Equity markets may respond to new driven events, but the moves themselves are predictable well in advance.
This past weekend, a few of our members were discussing the effect that news has on markets, and how Elliott Wave analysis has helped contribute to their decisions ahead of news-driven market events and enabling them to anticipate market direction by making investment decisions. This is a very practical observation, and as Ralph Elliott stated: "at best, news is the tardy recognition of forces that have already been at work for some time...".
In this article, I will discuss a few current news events and how it might affect markets in the coming weeks, but before doing so, I will discuss Elliott Wave Analysis as a useful tool in anticipating market direction and how it relates to news.
In the many articles I've written that have forecast directional movements in various asset classes and instruments, it seems there is a common misconception of Elliott Wave analysis, what it means, how it relates to our forecast of price action, and more important than anything, how one can use it as a meaningful tool to trade and make very real profits. First and foremost, it is important to understand that the Elliott Wave pattern of a particular index is never wrong. It is only the analyst's interpretation of the pattern that can be wrong. It is for this sole reason that many who have read about the use of Elliott Wave discount its usefulness as a tool at forecasting future directional market moves. However, drawing this conclusion would not only be wrong but would also eliminate one of the more powerful and useful tools to trading financial markets.
Elliott Wave analysis is probabilistic by nature and provides a clear methodology to allow the user the ability to assign reasonable probabilities to directional market moves. Does this mean that the analyst is always going to be correct? Of course, not. However, what it provides is a framework to allow an analyst to assign what is most probable and, at the same time, provide for very specific areas of support and resistance that if broken allows traders or investors to exit positions when the analysis is incorrect. As an example, if I told you that over the next 12 months you could invest long or short 10 times, where each time had a 70% probability of being correct and a 30% probability of being incorrect, and if correct, each opportunity provides a risk to reward ratio of 1:4, would that be of interest? Of course, it would, as anyone of us can quickly do the math, but allow me to do it for you. If you were risking $1,000 on each directional investment decision, then on the 70% you were correct, you would make $28,000 ($4,000 x 7), and on the 3 you were wrong, you would lose $3,000 ($1,000 x 3). So, $28,000 in gains less $3,000 of loss = $25,000 of profit.
To further this discussion, without exploring all the various nuances of Elliott Wave, there are a number of simple rules that provide for significantly higher probabilities. As an example, an impulsive wave structure that adheres to Fibonacci extension levels is rarely a stand along structure. For those unfamiliar, an impulsive directional move is a classic Elliott Wave 5-wave move with certain definitive rules. What this means is that when one can measure an impulsive move, then after a retrace of that move, at a minimum a similar sized 5 wave move in the same direction is extremely predictable. Another example relates to two potential directional alternatives, where both alternatives provide for some portion of price movement they share in common, of what we would refer to as the "high confidence" portion of price movement.
So, for those who choose to ignore, or worse yet, go out of their way to disparage the use of Elliott Wave as a useful tool to make probabilistic directional investment decisions, they are making a decision to ignore adding to their tool kit of analysis one of the most useful tools available today, and in this author's opinion, to use a pilot's analogy, making a decision to pilot a plane through a storm without the use of an instrument panel.
Elliott Wave and the accompanying use of Fibonacci math and other technical indicators can provide for extremely accurate market direction analysis. However, if there is one weakness in the use of Elliott Wave analysis, it would be timing. Directional market movements occur as a result of many things, of course, but the single largest influence that affects directional movements in markets is the sentiment of the crowd. Investors tend to make similar decision when confronted by degrees of confidence and uncertainty, and these collective decisions are inclusive in the overall wave structure of the market or instrument being analyzed. Quite obviously the crowd is also privy to the same current events, macro fundamental risks, and their collective observations of these collective macro risks, which is precisely why Ralph Elliott characterized news at the "tardy recognition of forces that have already been at work for some time." How many times have you seen a positive corporate earnings release where the stock responded to the downside? In truth, I would contend that in many instances one could know the news in advance of a release and still not be able to effectively or correctly the directional market reaction to the news.
Since Elliott Wave is a tool that can help one make probabilistic directional decisions relating to markets, as I said above, it's only as good as the analyst who uses it, and in the risk managed decisions they make from the use of this analysis. It is for this reason that we also use other modalities to accompany the use of Elliott Wave and Fibonacci. One such tool is Hurst Cyclic Analysis. While I will save a comprehensive explanation of Hurst Cyclic Analysis for another article, in a nutshell, what Hurst provides is an assessment of timing for certain peaks and troughs in financial markets. By knowing the probabilistic timing of a market trough, it better enables us to eliminate Elliott Wave alternatives and increase the odds that our own analysis has the highest probability of being the correct analysis.
Now, allow me to discuss the current Elliott Wave pattern and several news items and how they might relate. For those who have followed my recent articles on the S&P 500, you will know that so long as the S&P 500 stays below the high established in late July, we are ultimately expecting a move down into mid-2020 that will easily shave 25% from the high established then.
While there is countless news in the media right now, two of the biggies this week are the meeting relating to a potential trade deal with China and the pursuit of an impeachment of Mr. Trump. While there are varying opinions as to how either of these current events might affect markets, either negative or positive, allow me to provide what the Elliott Wave count is suggesting.
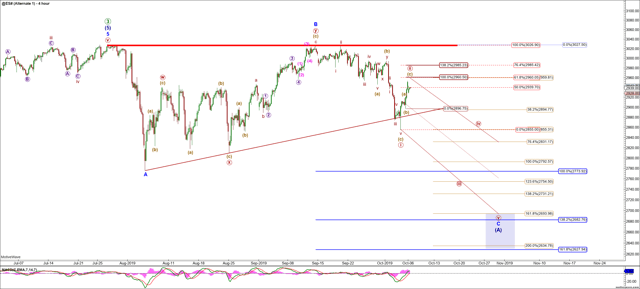
Below is the S&P 500 4 Hour Emini Futures Contract chart. Off the high in late July, we have what best counts as a 5-wave A wave. Following this move down is choppy price action that best counts as a wxy pattern for a B wave high that can be viewed as a virtual double top. Off this high, we have what best counts as a wave (I) of a leading diagonal to the downside that was followed by a reasonable retracement against the entire move down for a wave (II) that will most likely hit either the .618 retrace at 2960 or that can go as high as 2985, the .764 retrace. Assuming this assessment of the wave structure is correct, it portends a wave (II) down to 2792, the 1.0 extension, or 2754, the 1.236 extension, to then be followed by a deep (IV) then (V), culminating in the conclusion of this initial (A) wave down to 2627-2693.

As it relates to the news, what this analysis suggests is that either the crowd will most likely view the news in the coming weeks as negative. However, what is most important to recognize is that we are not attempting to forecast the news in order to then forecast the directional move in the markets, rather we are attempting to forecast the directional moves in the markets, and only being aware of how the news might affect this probabilistic outcome.
Anyone who claims that news does not act as a catalyst for movements in markets would be giving themselves way too much credit as an Elliott Wave analyst. However, and ultimately, the S&P 500 is roughly 80 points from the high and potentially 300 points from the low. If one is looking to make an investment short right now, this is a risk to reward of 1:4 with an Elliott Wave pattern that clearly supports continued downside. So, and once again, if I told you that you could make 10 investments per year with a risk to reward of 1:4, where each one has a 70% probability of being correct, as I stated above, then this is clearly one of those 10 annual opportunities being presented right now. There is nothing in markets that is 100%, but Elliott Wave and Fibonacci working tandem with Hurst Cyclic analysis is as good a set of tools as one can find for maneuvering markets over a period of time.